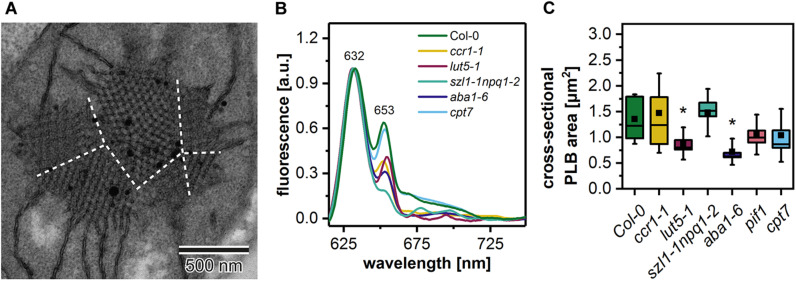
FIGURE 6.
Electron micrograph of a “polycrystalline” prolamellar body (PLB) (A); dashed white lines separate PLB regions arranged at different angles; note that PLB image is an enlargement of the Figure 5F micrograph. Representative low-temperature (77 K) fluorescence emission spectra (excitation at 440 nm) of cotyledons and the upper 2 mm of hypocotyl of 5-day etiolated Col-0 and ccr1-1, lut5-1, szl1-1npq1-2, aba1-6, cpt7 seedlings (B); all spectra were normalized to the maximal value. Measurements of the PLB cross-sectional area (C); description of the chart box as in Figure 2; results marked with asterisk on the top of the boxplot differ significantly at p = 0.05 from Col-0.

