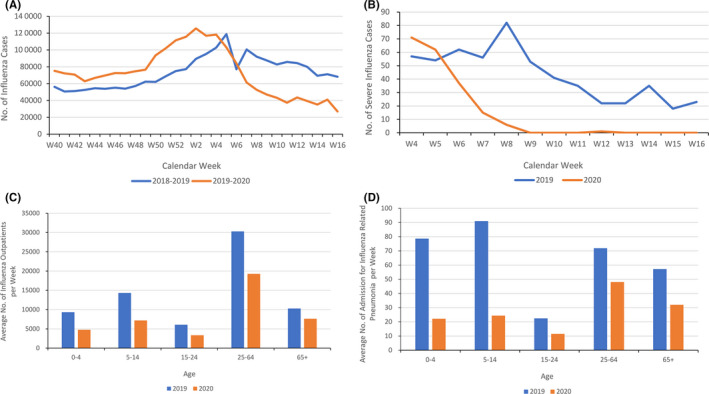
Figure 1.

A, Number of patients with Influenza per week in the 2018 to 2019 (blue) and 2019 to 2020 (orange) Influenza seasons. B, Number of patients with severe complications from Influenza per week after the fourth week of 2019 (blue) and 2020 (orange). C, Average number of outpatients with Influenza per Week after the fourth week of 2019 (blue) and 2020 (orange), by Age. D, Average number of patients admitted because of confirmed Influenza‐related Pneumonia per Week After the Fourth Week of 2019 (blue) and 2020 (orange), by age
