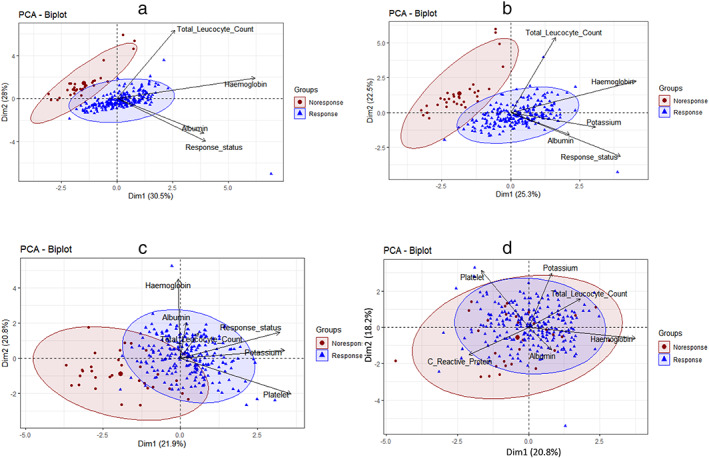
Figure 3.

Principal component biplots of significant parameters (total leukocyte count, hemoglobin, albumin, potassium, platelet, C‐reactive protein) of responders and nonresponders. Biplots of contributing variables show distinct separation of outcome variables. (a) biplot of three variables total leukocyte count, hemoglobin, and albumin; (b) biplot of four variables total leukocyte count, hemoglobin, albumin and potassium; (c) biplot of five variables total leukocyte count, hemoglobin, albumin, potassium, and platelet; (d) biplot of four variables total leukocyte count, hemoglobin, albumin, potassium, and C‐reactive protein.  , Nonresponse;
  , response.
