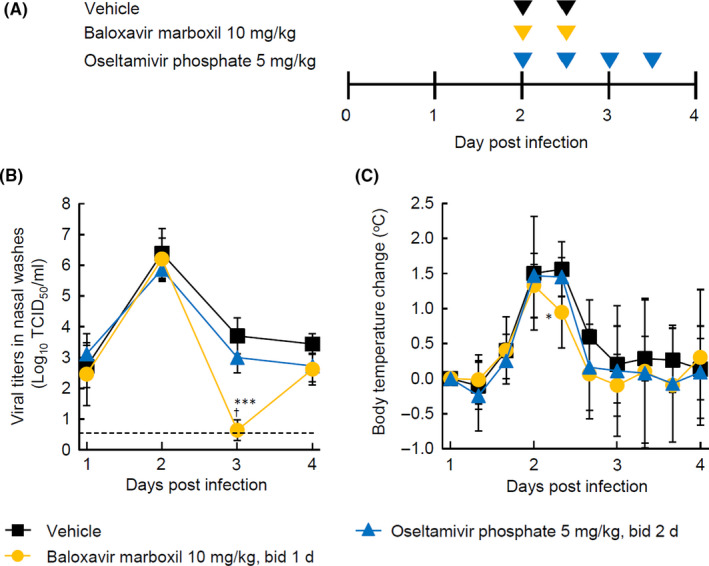
FIGURE 4.

Virus titers and change in body temperature of infected ferrets treated with baloxavir marboxil or oseltamivir phosphate (OSP), starting at Day 2 post‐infection. Each plot represents the mean ± standard deviation of six ferrets. A, Dosing schedule for the efficacy study. B, Virus titers in nasal washes over time. C, Body temperature changes from baseline over time. TCID50, 50% tissue culture infective dose. Asterisks indicate statistically significant difference, as follows: *P < .05; ***P < .001 compared with vehicle; † P < .01 compared with OSP
