Figure 3.

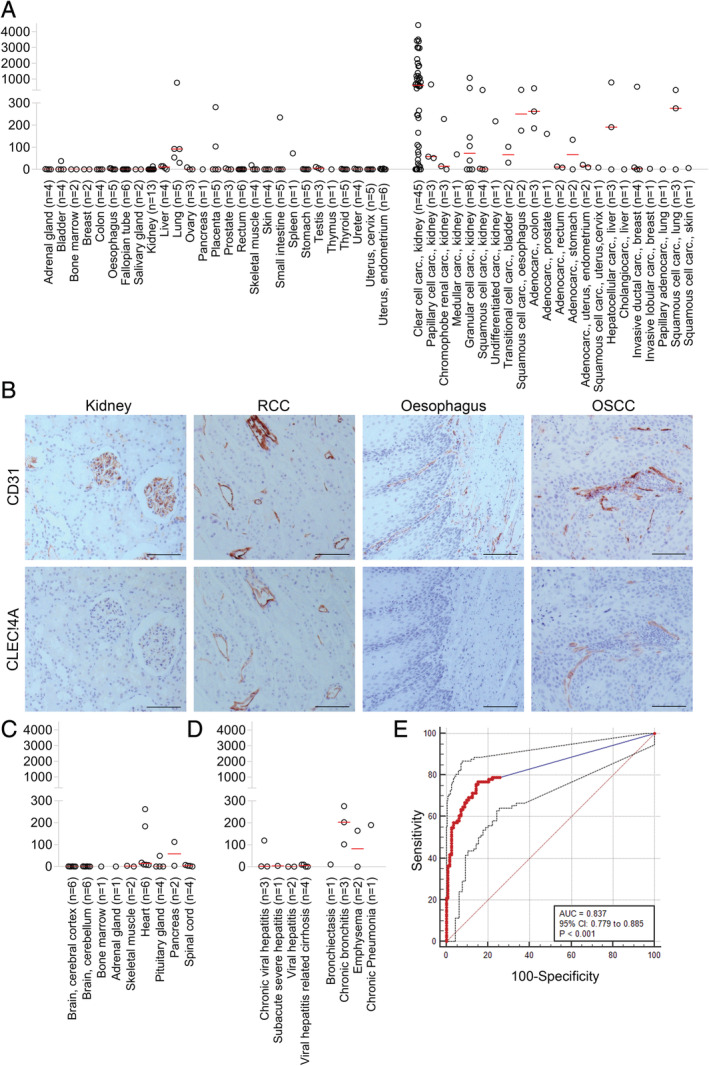
CLEC14A expression in healthy, cancer and non‐cancer pathologies. (A) CLEC14A staining scores for surgical samples from healthy (left) and tumour (right) tissue. Red line = median score. (B) Representative images of CD31 and CLEC14A staining on healthy kidney, renal clear cell carcinoma (RCC), healthy oesophagus and oesophageal squamous cell carcinoma (OSCC). Concentration matched isotype control antibody staining was negative. Scale bars = 100 μm. (C) CLEC14A staining scores for autopsy samples of normal human tissues. Red line = median score. (D) CLEC14A staining scores for surgical samples of non‐cancer diseased human tissues. Red line = median score. (E) ROC curve analysis of staining score in tumour tissues (n = 91) relative to control samples (n = 112).
