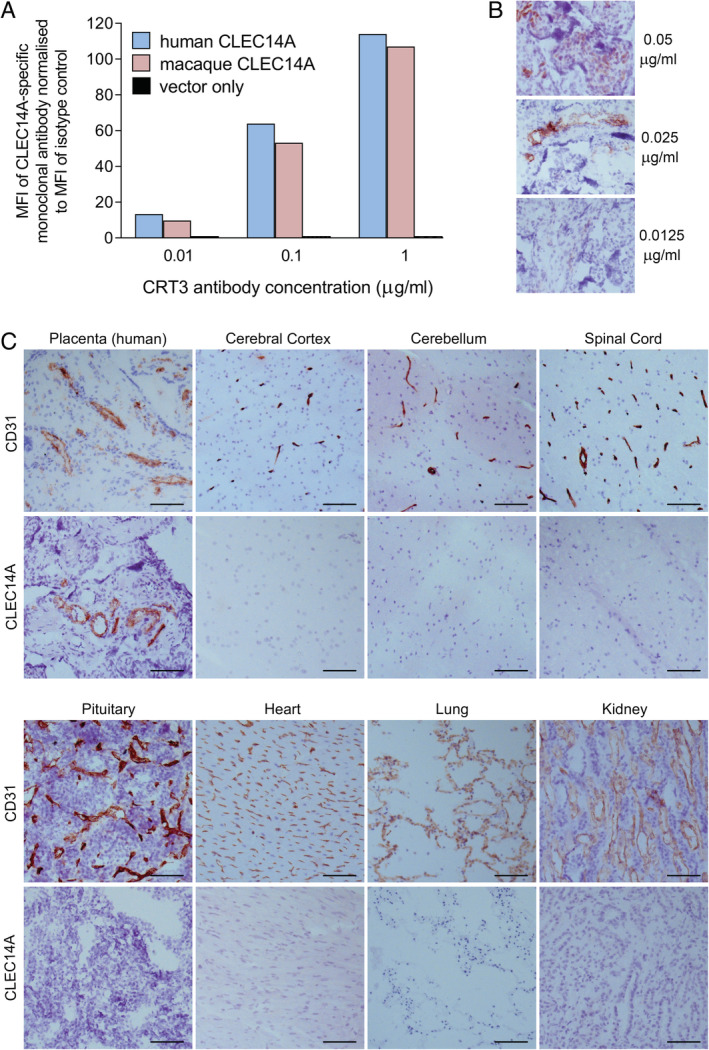
Figure 4.

CLEC14A protein expression in cynomolgus macaque tissues. (A) Flow cytometric analysis of CRT3 staining of human and cynomolgus macaque CLEC14A‐expressing HEK293T cells. Mean fluorescence intensity (MFI) was normalised by dividing by the MFI of wild type HEK293Tcells stained at the same antibody concentration. (B) Optimisation of immunohistochemical staining for CLEC14A in frozen human placenta sections using the CRT3 monoclonal antibody. Representative images shown. (C) Images of CD31 and CLEC14A staining on frozen sections of human placenta and cynomolgus macaque tissues. Concentration‐matched isotype control antibody staining was negative. All scale bars = 100 μm.
