Fig. 3.
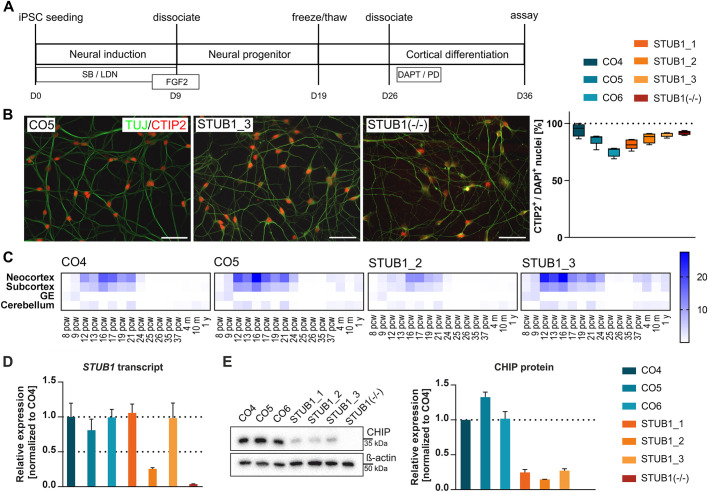
Characterization of iPSC-derived neurons. (A) Schematic representation of the experimental procedure of the differentiation of iPSCs into iPSC-derived CNs. SB, SB431542; LDN, LDN193189; PD, PD0325901. (B) Immunocytochemical stainings of CNs on D36 for TUJ (green) and CTIP2 (red). Scale bars: 50 µm. Exemplary stainings of three lines are shown. Quantification of the percentage of CTIP2+/DAPI+ cells in controls, patients and STUB1(−/−) was performed for four to five fields per cell line. Values are given as boxplots showing minimum to maximum, with the mean indicated by a line. (C) Transcript expression in CNs match the best expression found in neocortical tissue at postconception week 16. Heatmaps were produced for two controls (CO4 and CO5) and two patients (STUB1_2 and STUB1_3) by Wilcoxon rank-sum comparisons of CN transcripts to the BrainSpan atlas, and results are shown as –log 10 P-values of significant differences. All four generated lines display a similar expression pattern. (D) Transcript level of STUB1 in three controls, three patients and the homozygous knockout line. Levels are normalized to CO4. Dotted lines indicate full transcript level and 50% reduced transcript level. (E) CHIP protein expression level was analyzed by western blotting. One representative blot is shown. Bands are quantified densitometrically and normalized to ß-actin and CO4. Data are mean±s.e.m. n=3. GE, ganglionic eminence; iPSC, induced pluripotent stem cells; pcw, postconception week.

