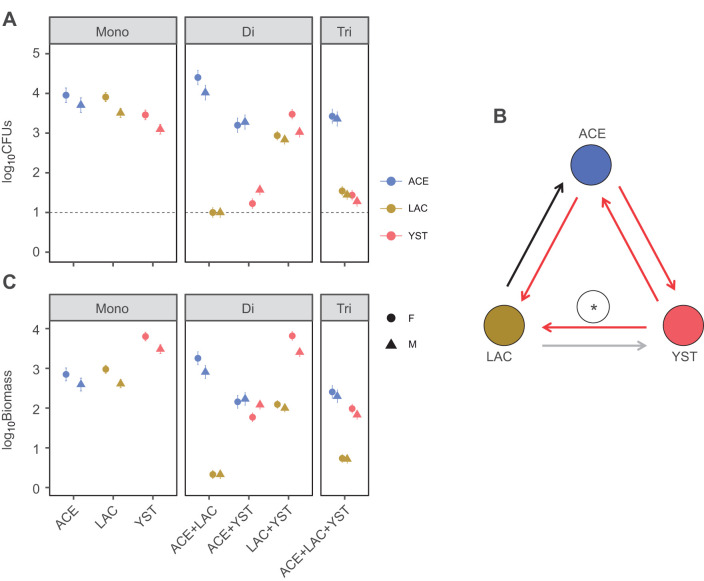
Fig. 1.
Abundance of microorganisms in flies. (A) Number of colony forming units (CFUs) per fly (means±s.e., n=18). The black line indicates the limit of detection per fly. The estimated marginal means and standard error from ANOVA analyses are plotted. Results from statistical analyses are provided in Table S1A. (B) Pairwise effects of co-association on microbial abundance (ACE, Acetobacter fabarum; LAC, Lactobacillus brevis; YST, Hanseniaspora uvarum). Arrows indicate co-association effects (black, positive; red, negative; and gray, null) and the yeast amelioration of the negative effect of ACE on LAC in the tri-association is shown by the asterisk. (C) Estimated biomass (pg) of microorganisms (means±s.e., n=18). Data in A and C are for female (F) and male (M) flies. Mono, mono-association; Di, di-association; Tri, tri-association.

