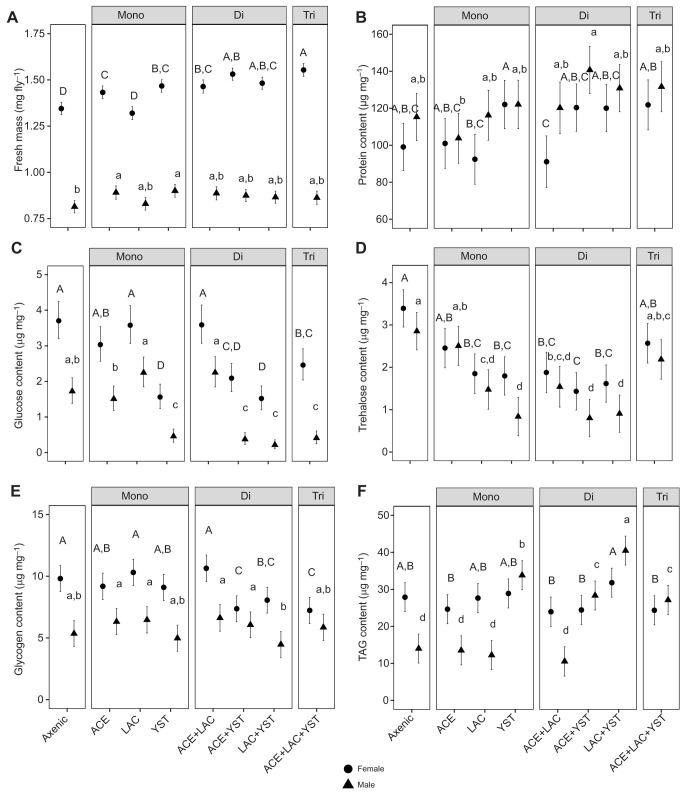
Fig. 3.
Individual nutritional indices in flies colonized with different microorganisms. (A) Average fresh mass. (B) Protein content. (C) Glucose content. (D) Trehalose content. (E) Glycogen content. (F) Triacylglyceride (TAG) content. The estimated marginal mean and 95% CI are plotted from each ANOVA model (n=18). Letters indicate post hoc Tukey test results with female- and male-specific comparisons indicated by capital and lowercase letters, respectively. A full description of statistical tests is given in Table S1D.

