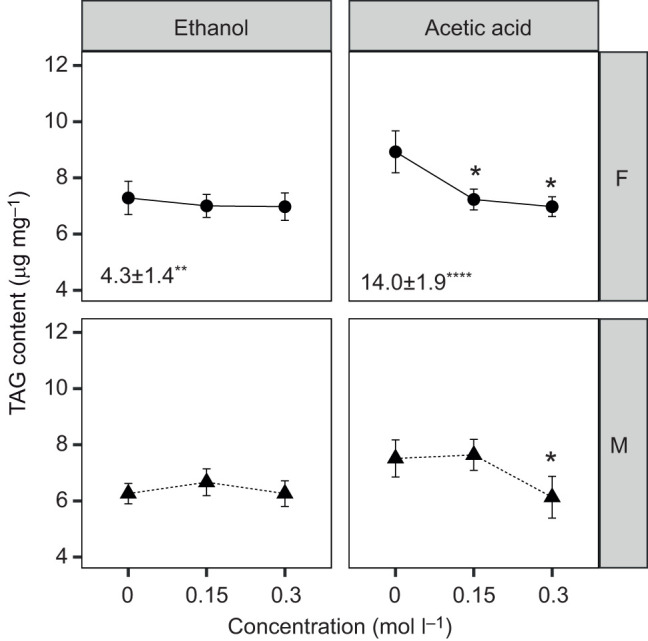
Fig. 5.

TAG content of axenic flies administered microbial fermentation compounds. The effect of ethanol and acetic acid on TAG content is indicated with raw means±s.e. (n=18). *P<0.05 for post hoc Dunnett's test from each ANOVA model. The covariate slopes and s.e. for mass per fly from each ANOVA model are included at the bottom of each panel when significant; the volume of diet consumed by the flies was non-significant for all experiments (*P<0.05, **P<0.01, ****P<0.0001). Statistical analyses are provided in Table S1F and ANOVA model plots are included in the extended version of Fig. S5 (Dryad: https://datadryad.org/stash/share/7vqNjVDRg5yTuB_fdVIxYE-Tlly4ky9al5RdySr37TI).
