Fig. 6.
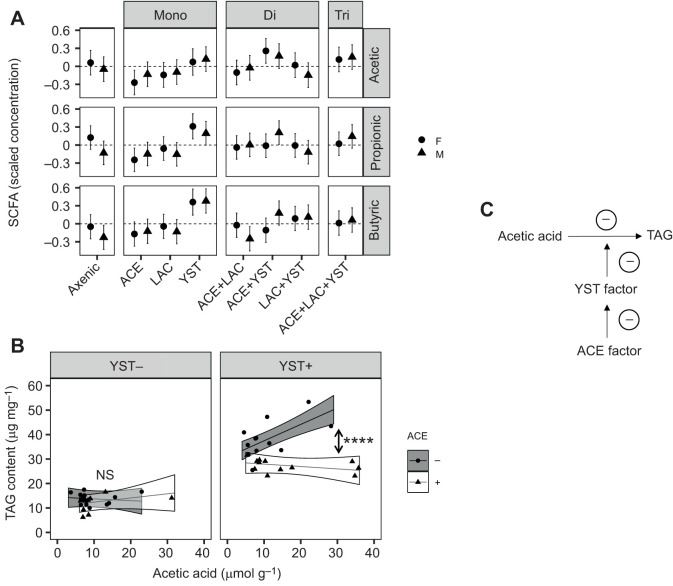
Short chain fatty acid (SCFA) content of Drosophila colonized with different microorganisms and the association between SCFA acetic acid and TAG content. (A) SCFA profile of flies. The dashed horizontal line indicates the mean concentration across all treatments for each SCFA (acetic, propionic and butyric acid). The estimated marginal means and 95% CI from ANOVA analyses are plotted (n=6). CI that do not overlap with zero indicate a significant effect of microbial treatment on SCFA concentration. Statistical analyses are provided in Table S1G. (B) Moderation analysis of microbial effect on TAG content by acetic acid titer. The data are the linear prediction for male fly TAG content by acetic acid titer for the presence (+) and absence (−) of ACE and YST in all combinations from the moderation analysis with the results averaged over LAC treatments. The ribbon around the line represents the CI with symbols displaying individual replicates sampled. A post hoc linear contrast was performed comparing the effect of the presence of ACE on the regression slopes with and without YST. Asterisks indicate statistical significance (****P<0.0001); NS, not significant. (C) Proposed ACE and YST factors influencing the relationship between acetic acid and TAG (see Discussion for details).

