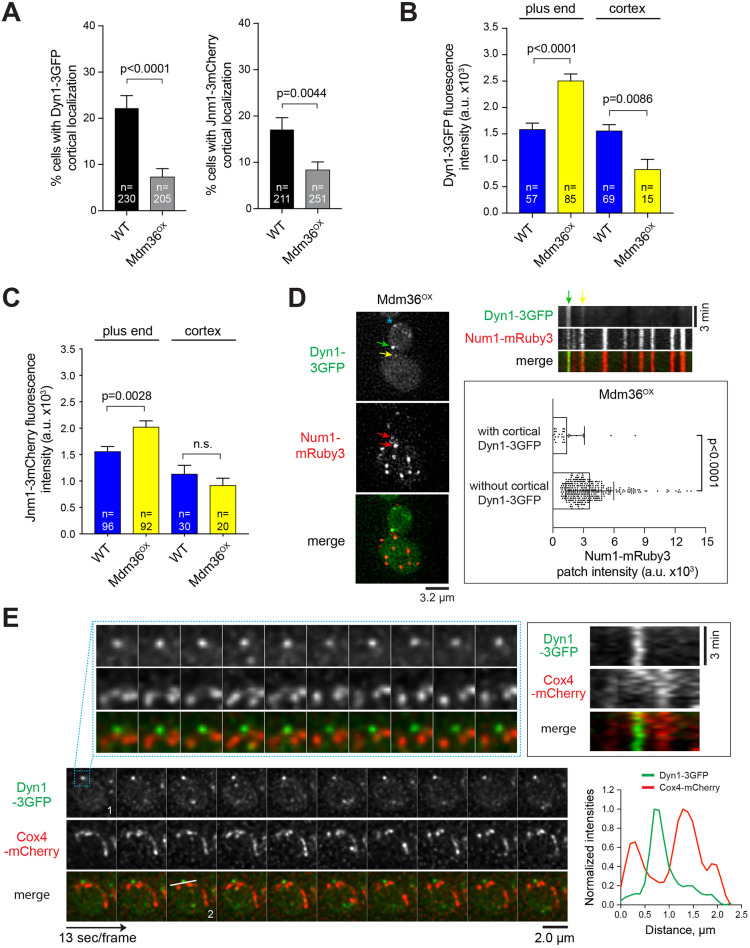
Fig. 3.
Defects in dynein and dynactin localization in Mdm36OX cells. (A) Frequency of observing cortical Dyn1–3GFP (left) and Jnm1–3mCherry (right) patches in the indicated strains. Error bars represent the standard error of proportion (s.e.p.). P-value calculated using an unpaired t-test. (B,C) Dyn1–3GFP and Jnm1–3mCherry mean fluorescence intensity at the MT plus end and cell cortex. Error bars represent s.e.m. P-value calculated using an unpaired t-test. n.s., not statistically significant. (D) Left, deconvolved wide-field images of a representative Mdm36OX cell expressing Dyn1–3GFP and Num1–mRuby3. Green and yellow arrows mark stationary cortical Dyn1–3GFP foci (see kymograph, top right). Asterisk marks a motile plus-end Dyn1–3GFP focus (based on time-lapse sequence). Red arrows mark Num1–mRuby3 clusters possessing Dyn1–3GFP signal. Top right, kymograph of Dyn1–3GFP and Num1–mRuby3 foci from the same cell shown on the left. Bottom right, mean intensity of Num1–mRuby3 foci that possess or lack Dyn1–3GFP signal in Mdm36OX cells (n=338). Error bars represent s.d. P-value calculated using an unpaired t-test. (E) Deconvolved time-lapse images of Dyn1–3GFP and Cox4–mCherry in an Mdm36OX cell. A region of the cortex (indicated by the box in frame 1) is enlarged to illustrate the lack of colocalization between dynein and mitochondria. Top right, kymograph showing the behavior of dynein and mitochondria along the cortex of the enlarged region. Stationary dynein (green) and motile mitochondria (red) did not appear to be anchored to the same cortical spot. Bottom right, intensity profile plot (along the line drawn in frame 2) showing non-overlapping peaks of Dyn1–3GFP and Cox4–mCherry signals.

