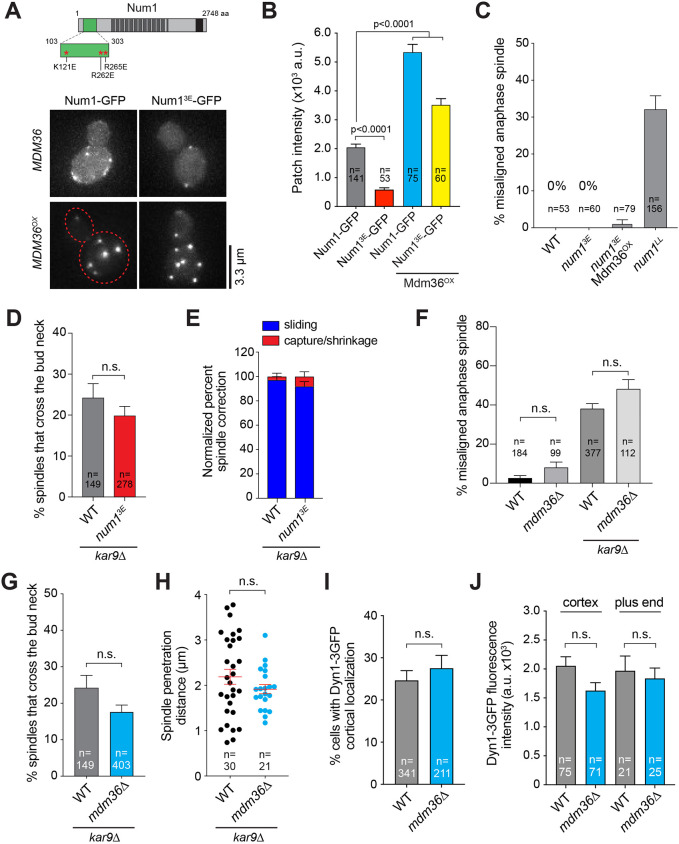
Fig. 5.
Num13E forms cortical patches that are functional in the dynein pathway. (A) Schematic diagram indicating the location of 3E mutations in Num1. Bottom, representative images of Num1–GFP and Num13E–GFP in WT (MDM36) and Mdm36OX backgrounds. Each image is a maximum intensity projection of five optical sections spaced 0.5 µm apart. Red dashed line indicates cell outline. (B) Mean intensity of Num1–GFP patches for the strains indicated in A. Error bars represent s.e.m. P-values calculated using unpaired t-tests. (C) Percentage of anaphase spindles with a misoriented phenotype for the indicated strains. Error bars represent the standard error of proportion (s.e.p.). (D) Percentage of HU-arrested spindles that crossed the bud neck during a 10-min movie. Error bars represent s.e.p. (E) Quantification of spindle correction mechanisms in the indicated strains (36≤n≤50 events per strain). Error bars represent s.e.p. (F) Percentage of misoriented anaphase spindles for the indicated strains. Error bars represent s.e.p. n.s., not statistically significant by one-way ANOVA test. (G) Frequency of observing HU-arrested spindles crossing the bud neck during a 10-min movie. Error bars represent s.e.p. (H) Distance of spindle penetration. Horizontal lines indicate the mean. Error bars represent the s.e.m. (I) Frequency of observing cortical Dyn1–3GFP patches. Error bars represent s.e.p. (J) Mean fluorescence intensity of Dyn1–3GFP at the MT plus end and cell cortex. Error bars represent s.e.m. For D and G–J: n.s., not statistically significant by unpaired t-test.

