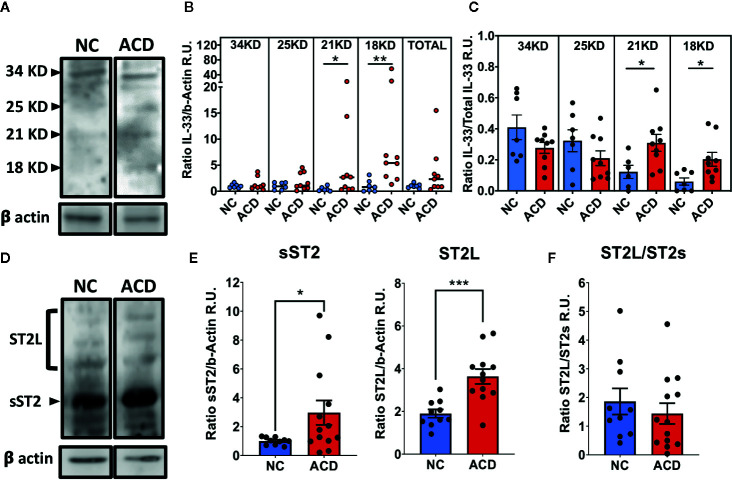
Figure 3.
Increased levels of cleaved IL-33 fragments, ST2L and sST2 in duodenal samples of active CD patients and controls. (A, D) Representative images of Western blot analysis for ST2L and sST2 or the different cleaved IL-33 (25kDa, 21/20kKDa or 18kDa) or full protein (34kDa) fragments. Beta actin was used as the loading control protein in all cases. (B) Ratio of signal density of each of the IL-33 forms and beta-actin (NC = 7 and ACD = 9). (C) Relative proportion of each of IL-33 fragments for ACD and NC populations (NC = 7 and ACD = 9). (E) Ratio between signal density of bands corresponding to ST2s (NC = 10 and ACD = 13) or ST2L (NC = 10 and ACD = 12) and beta-actin signal. (F) Ratio between signal density of ST2L and ST2s for ACD and controls (NC = 10 and ACD = 12). In B, the median value is represented with a horizontal line for each population. for ACD and controls. The C, E, F plots are shown with average bars plus SEM bars. t-test with Welch was performed. Mann Whitney Test was performed for IL-33 relative to beta actin analysis (*p < 0.05; **p < 0.01; ***p < 0.001). Beta-Actin was used as loading control. R.U., Relative units.

