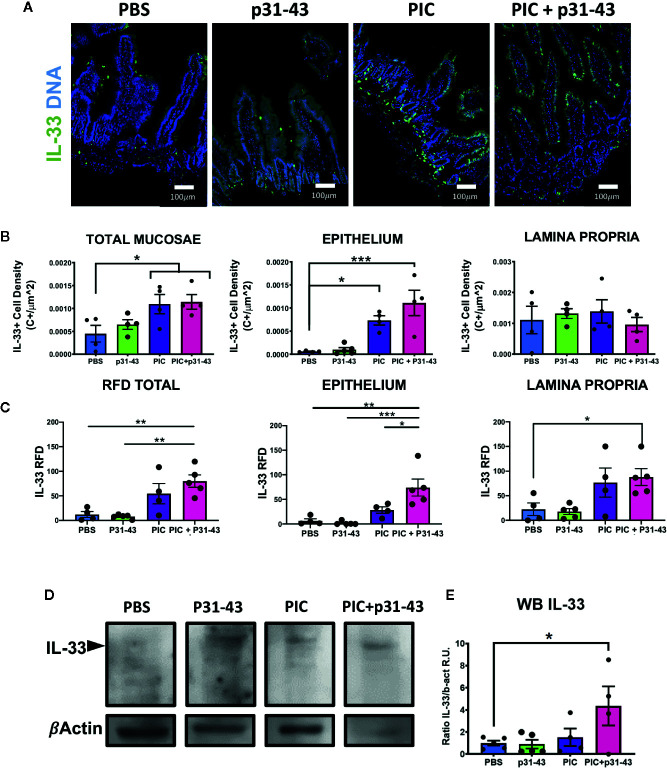
Figure 5.
Induction of IL-33 in an acute inflammatory response in a mice model. (A) Representative images of immunofluorescence analysis of duodenal sections of each of mice treated with: PBS, p31-43, PIC or PIC+p31-43. The IL-33 staining is shown in green and Cell Nuclei in blue. (B) Results of IL-33+ cell density on total mucosae, epithelium or lamina propria for each of the conditions. (C) Results of IL-33+ RFD analysis on total mucosae, epithelium or lamina propria for each of the conditions. (D) Representative western blot analysis of IL-33 analysis in whole mucosae of each of the conditions. (E) Results of the analysis of IL-33 western blot for each of the conditions relative to beta actin signal and control stimuli (PBS). One-way ANOVA, post-test Tukey. (*0.01 < p < 0.05, **0.001 < p < 0.01, ***p < 0.001).

