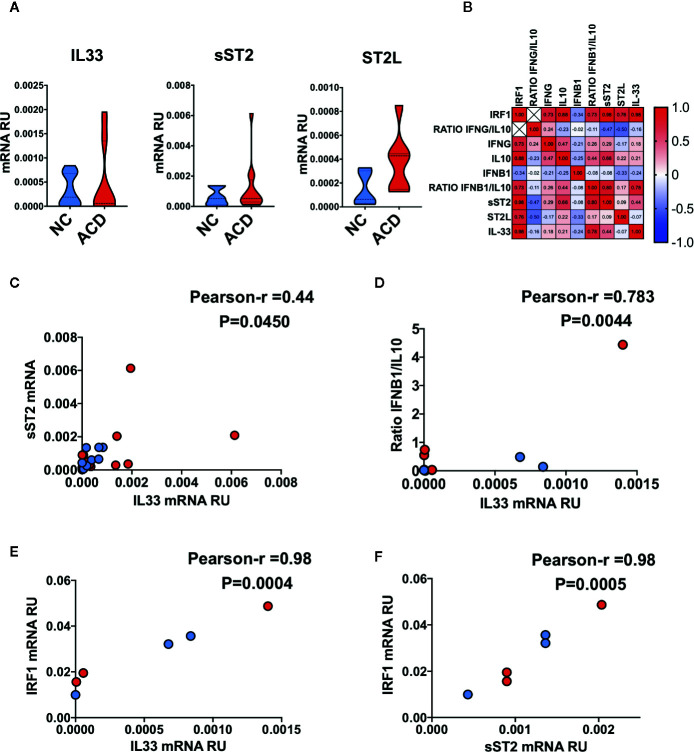
Figure 7.
Correlation between the IL33/ST2 axis and inflammatory markers in duodenal mucosae. (A) Violin plots of qPCR results for IL33 gene (NC = 11, ACD = 15) and IL1RL1 splice variants corresponding to sST2 (NC = 10, ACD = 12) and ST2L (NC = 5, ACD = 7) proteins. (B) Correlation heatmap of Pearson r values between different genes evaluated in ACD and NC individuals. (C) Correlation plot of sST2 mRNA with IL33 mRNA. (D) Correlation plot of ratio IFNB1/IL10 with IL33 mRNA. (E) Correlation plot of IRF1 mRNA with IL33 mRNA. (F) Correlation plot of IRF1 mRNA with sST2 mRNA. All ACD samples are shown as red dots and NC as blue dots, p-value is shown for each correlation. Unpaired T-test was used as the statistical analysis in (A) and Pearson correlation analysis for multiple correlations of different genes in (B–E). The p-value < 0.05 was considered statistically significant.

