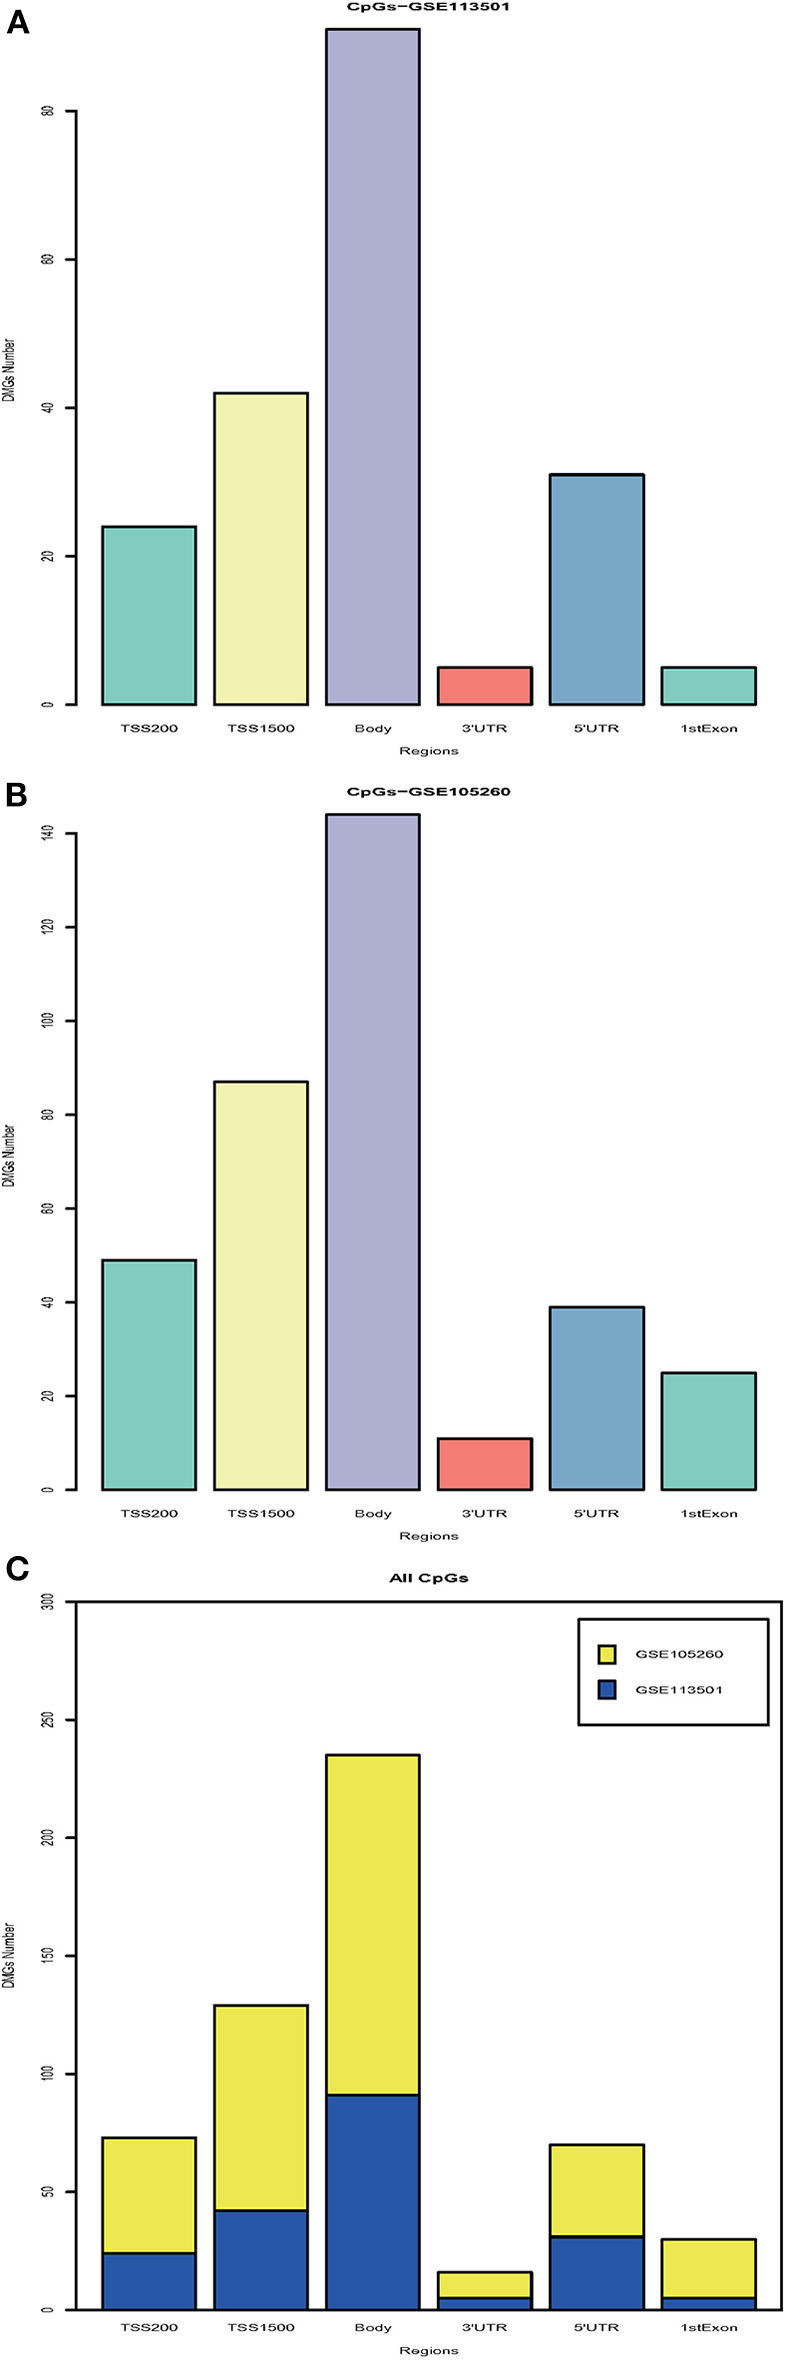
Figure 1.

Integration analysis of DMGs. (A) Barplot for different region DMGs in GSE113501. The y-axis indicates the number of DMGs and the x-axis shows the positions around CpG islands: TSS1500, TSS200, 5′UTR, 1stExon, body, and 3′UTR. TSS1500 refers to 200–1,500 bases upstream of the transcriptional start site (TSS). TSS200 means 0–200 bases upstream of TSS. 5′UTR stands for the 5′untranslated region located between the TSS and the ATG start site. 1stExon is short for the first exon of the gene. Body is the region between ATG start site and stop codon. 3′UTR is short for 3′untranslated region that is between stop codon and poly-A tail. (B) Barplot for different region DMGs in GSE105260. (C) Barplot for all DMGs based on different regions. The blue module stands for DMGs in GSE113501. The yellow module represents for DMGs in GSE105260.
