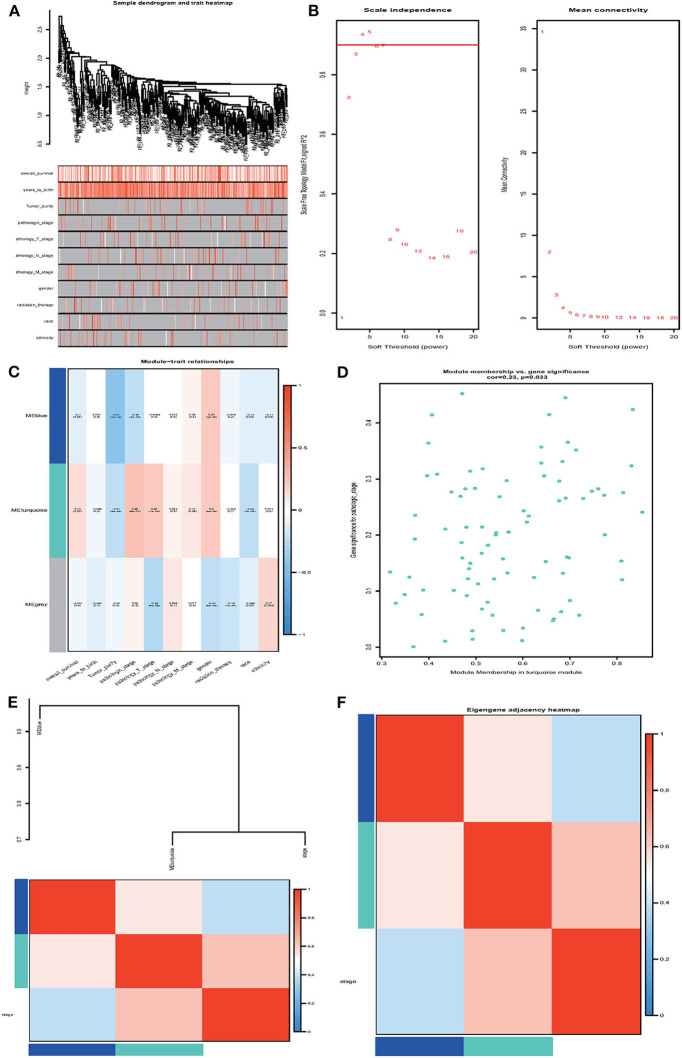
Figure 5.
Weighted gene co-expression network analysis (WGCNA). (A) Sample dendrogram and trait heatmap. (B) Analysis of the scale-free fit index and the mean connectivity for various soft-thresholding powers (β). (C) Heatmap of correlation between module eigengenes and clinical information. (D) Module membership in the turquoise module. (E,F) The correlation between each module and clinical characteristic pathological stage was demonstrated based on Eigen gene. Blue represents a negative correlation, while red represents a positive correlation.

