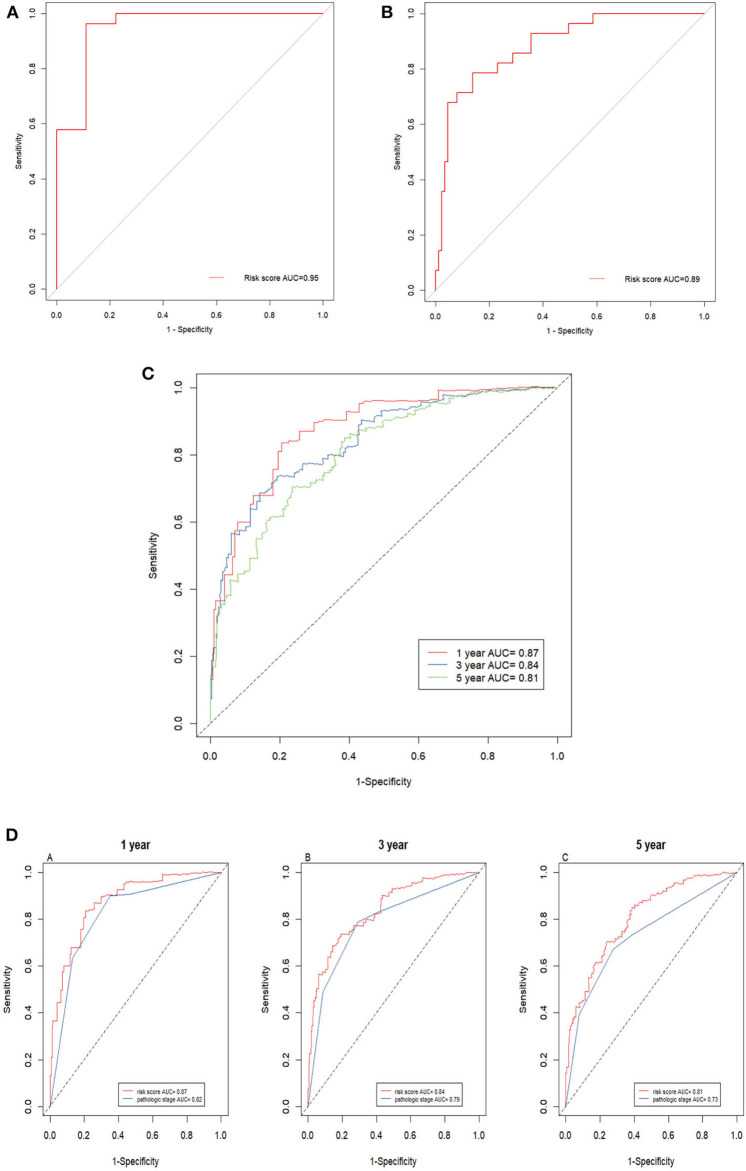
Figure 7.
ROC curves of 12-gene signature. (A) ROC curves of the 12-gene signature in GSE105260 (AUC = 0.95). (B) ROC curves of the 12-gene signature in GSE105260 (AUC = 0.89). (C) Time–dependent ROC curve for OS, the AUC was assessed at 1, 3, and 5 year (AUC = 0.87, 0.84, and 0.81). (D) Time-dependent ROC curve analysis evaluates the accuracy of the 12-gene model.

