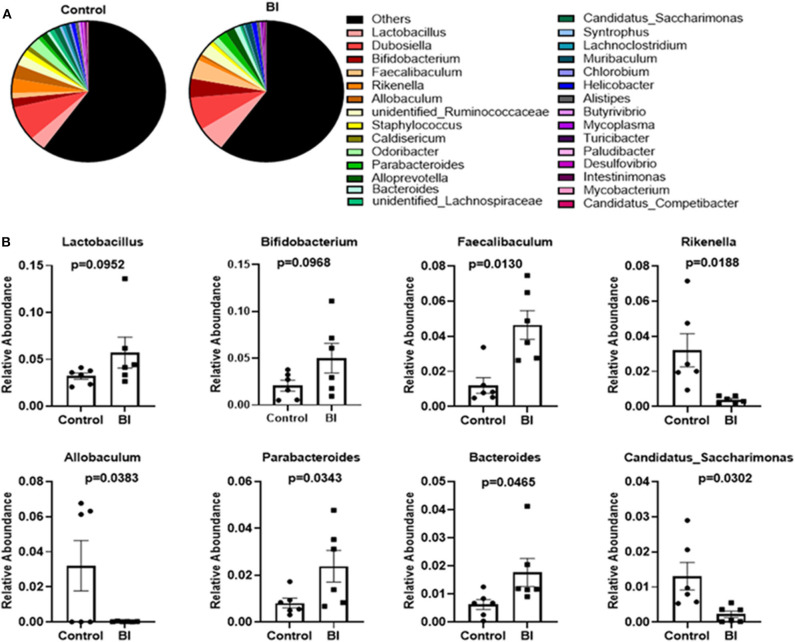
Figure 7.
The changes in the relative abundance at the genus level of the gut microbiota of mice in the control group and BI treatment group at day 28. (A) The relative abundance of the top 30 genera between two groups. (B) BI affected the specific bacterial genera. Values are means ± SEM (n = 6 mice/group). Control, control diet; BI, B. inquinans.

