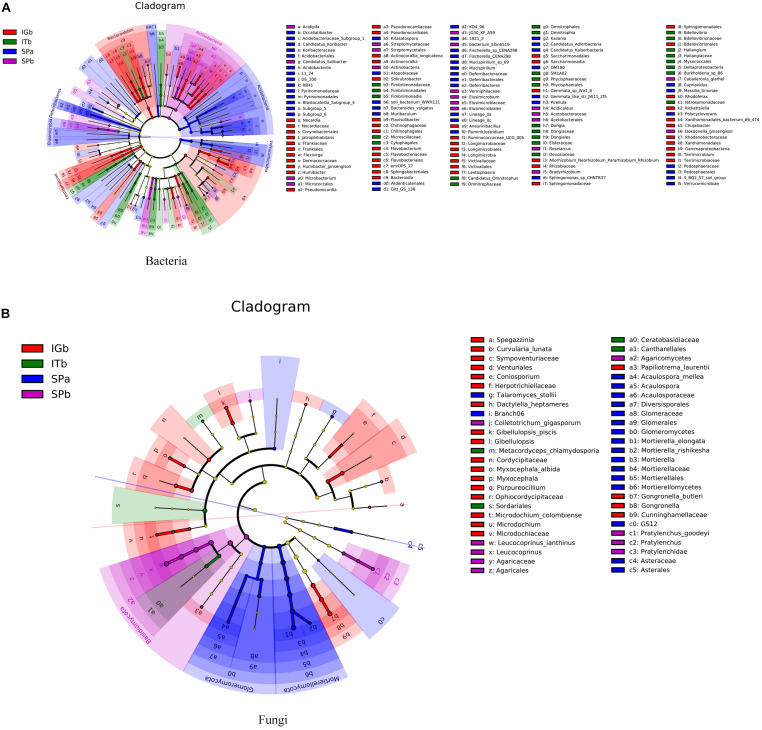
FIGURE 5.
Evolutionary diagrams for the bacteria and fungi when the various planting modes were applied. Each small circle in the figure represents a category at the group level. The inner to outer circles are different categories. In the horizontal classification tree, the diameter of the circle is proportional to the relative abundance. The groups are distinguished by different colors where the colored nodes represent microbial groups that play an important role in the corresponding color group. The yellow nodes represent microbial groups that did not play an important role in any of the treatment groups. (A) Differences in classification levels of bacterial community from phylum to species. (B) Differences in classification levels of fungal community from phylum to species.

