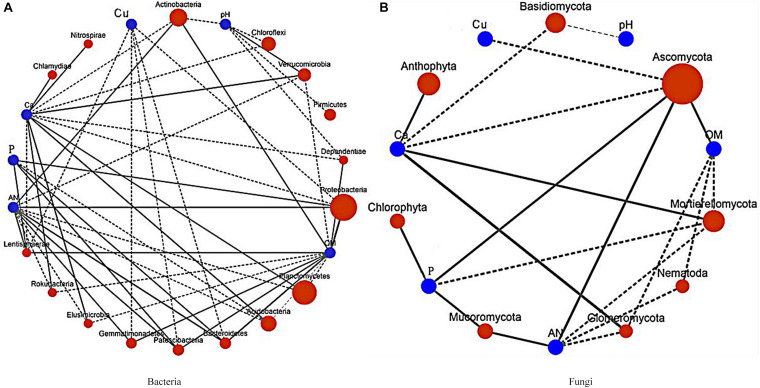
FIGURE 8.
Correlation diagram showing the relationships between the dominant bacteria and fungi and the soil physical and chemical index network. P, available potassium; Ca, exchangeable Ca; Cu, available Cu; OM, organic matter; and AN, alkali-hydrolyzable nitrogen. (A) Correlation network of the dominant bacteria and the soil physical and chemical index. (B) Correlation network of the dominant fungi and the soil physical and chemical index.

