FIGURE 4.
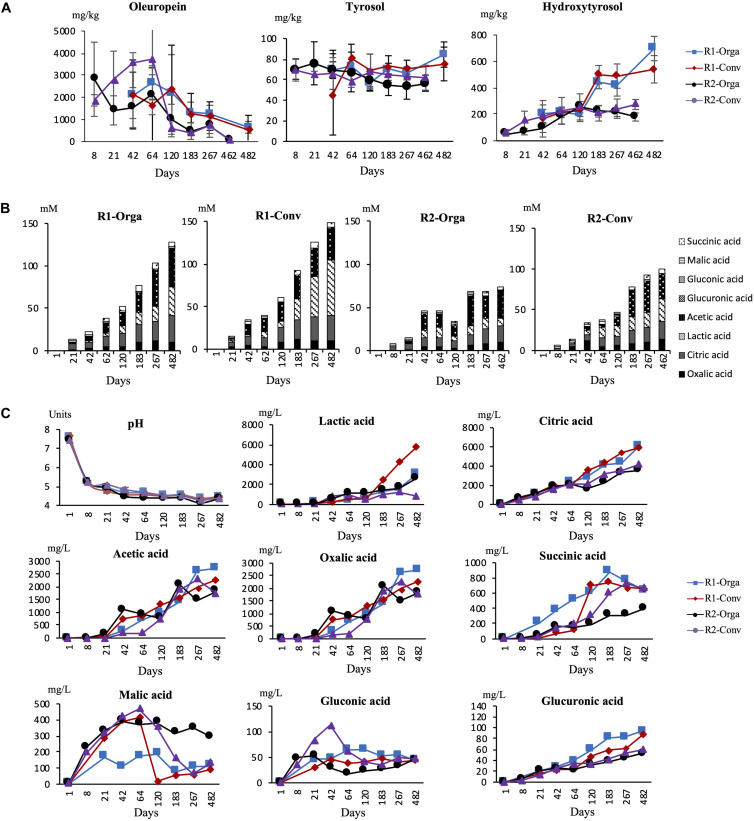
pH and biochemical concentration changes during Nyons table olive fermentations. (A) Phenolic compound concentration in olive fruit during fermentation in mg/kg of olive pulp, (B) Total acid concentration in brine in mM and (C) pH/individual acid concentration evolution in mg/L of brine. R1-Orga, early harvest-organic olives; R1-Conv, early harvest–conventional olives; R2-Orga, late harvest-organic olives; R2-Orga, late harvest conventional olives. Data are expressed as mean values from triplicate (tanks) determinations.

