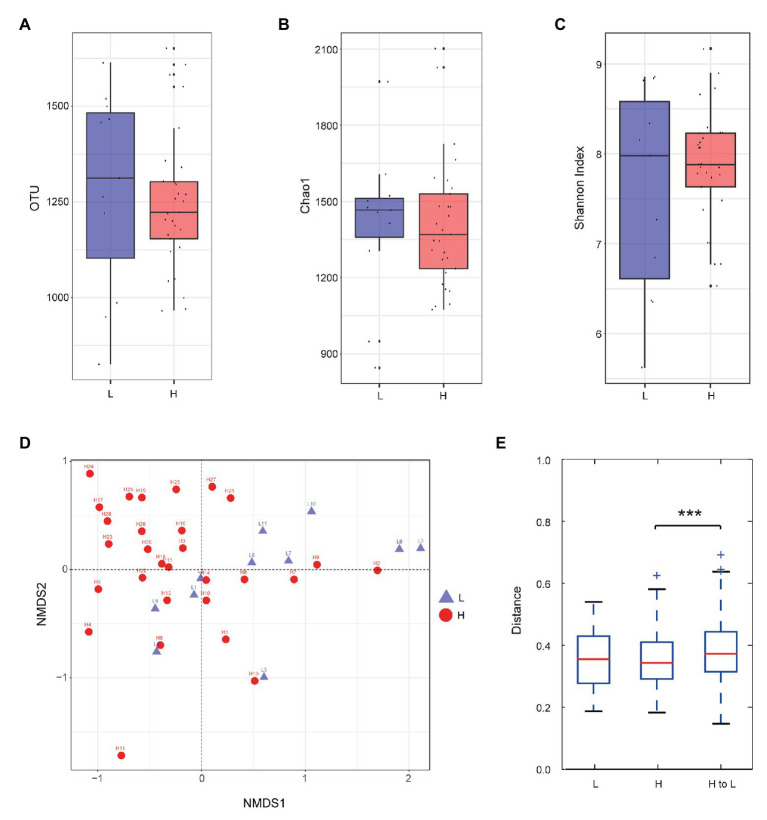
Figure 1.
Alpha and beta diversity of gut microbiota. (A–C) Boxplots of observed operational taxonomic units (OTUs) (A), Chao1 index (B), and Shannon index (C) for the low semen utilization rate (L) and high semen utilization rate (H) groups. Red indicates the H group and blue indicates the L group. Boxes show the medians and the interquartile ranges (IQRs), the whiskers denote the lowest and highest values that were within 1.5 times the IQR from the first and third quartiles, and outliers are shown as individual points. (D) Nonmetric multidimensional scaling (NMDS) plot. The red circles indicate the H group, and the blue triangles indicate the L group. (E) Interindividual variations were determined by average weighted-UniFrac distances between individuals in the L and H group boars. Intraindividual variations were determined by distance-paired H and L group boars. ***p < 0.001.

