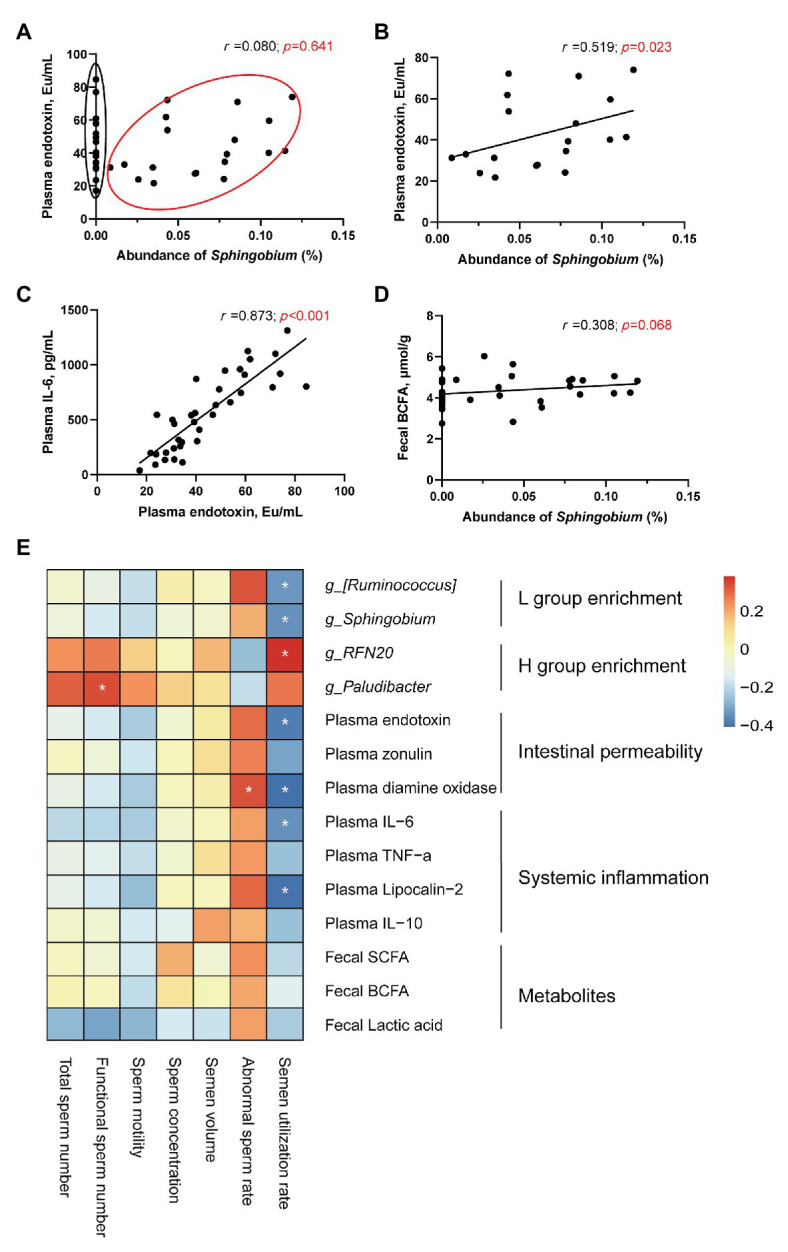
Figure 6.

Spearman correlation analysis. (A) Correlation analysis between plasma endotoxin and the abundance of Sphingobium (n = 36). (B) Correlation analysis between plasma endotoxin and the abundance of Sphingobium (n = 19). (C) Correlation between plasma endotoxin and plasma IL-6. (D) Correlation between the abundance of Sphingobium and fecal BCFAs. (E) Heat map of the Spearman r correlations between the clinical status and semen parameters of boars. *p < 0.05.
