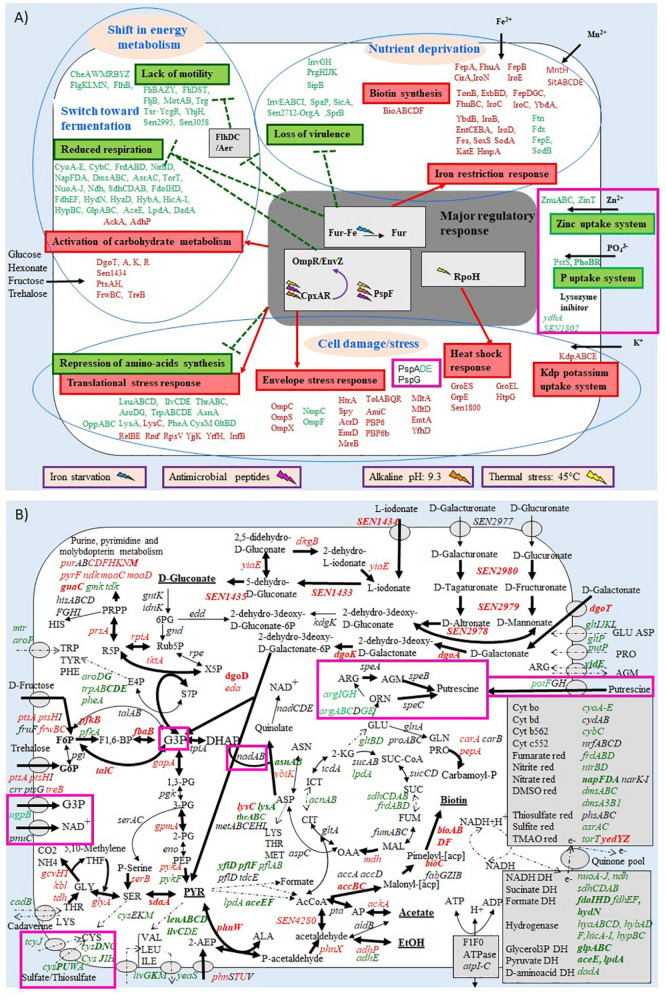
FIGURE 3.
Summary of the effect of S. Enteritidis 45 min exposure to EWF (A,B) on selected metabolic pathways. Transporters are symbolized by gray ovals. Up-regulated, down-regulated, and non-regulated genes are represented in red, green or black, respectively. Genes with a ≥4-fold change in expression are in bold. The metabolites predicted to be increased are underlined. Up-regulated, down-regulated and non-regulated pathways are represented by thick, broken, or fine arrows, respectively. Genes with different expression levels between the incubation in EWMM (from Baron et al., 2017) and in EWF are boxed in pink. Metabolic pathway data were obtained from KEGG (www.genome.jp/kegg).

