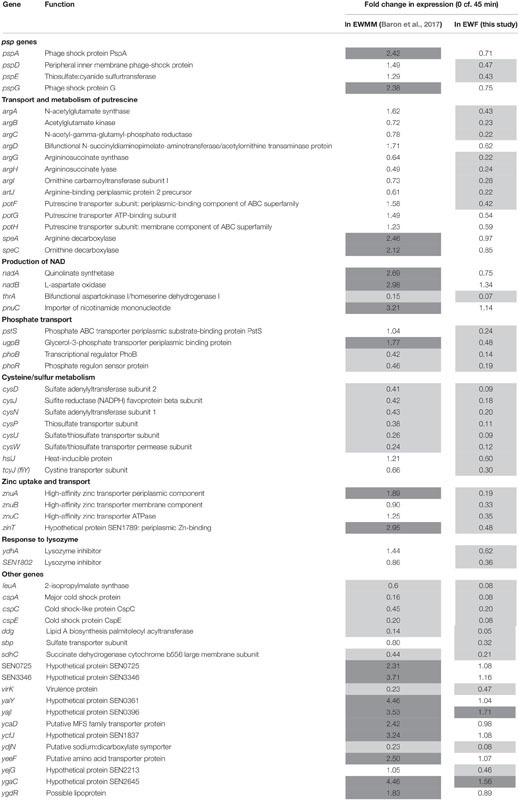
TABLE 2.
Genes of S. Enteritidis differentially expressed in EWMM (with EW proteins) and in EWF (free of EW proteins of > 10 kDa).
 |
Highlighted expression changes correspond to significantly (p≤ 0.05) up-regulated (dark gray) or down-regulated (light gray) changes after 45 min exposure to EWMM or EWF. Only genes exhibiting a ≥2-fold expression difference ratio between EWMM (data from our previous study Baron et al., 2017) and EWF (data from this study) after 45 min exposure at 45°C were listed in this table.
