
Figure 4.
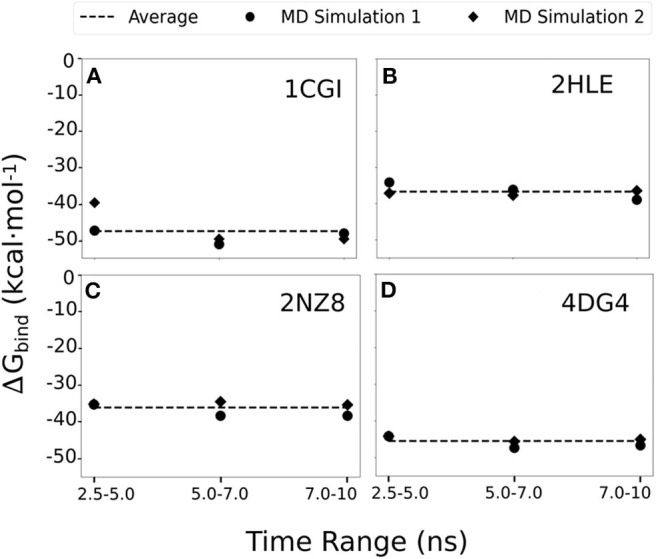
MMGBSA binding free energy calculations estimated using 250 snapshots retrieved from 2.5 to 5.0, 5.0 to 7.0, and 7.5 to 10 ns of two independent MD simulation productions for each of the studied systems (A) 1cgi, (B) 2hle, (C) 2nz8, and (D) 4dg3. The average binding free energy for each case is shown as a dashed line along the graphs.