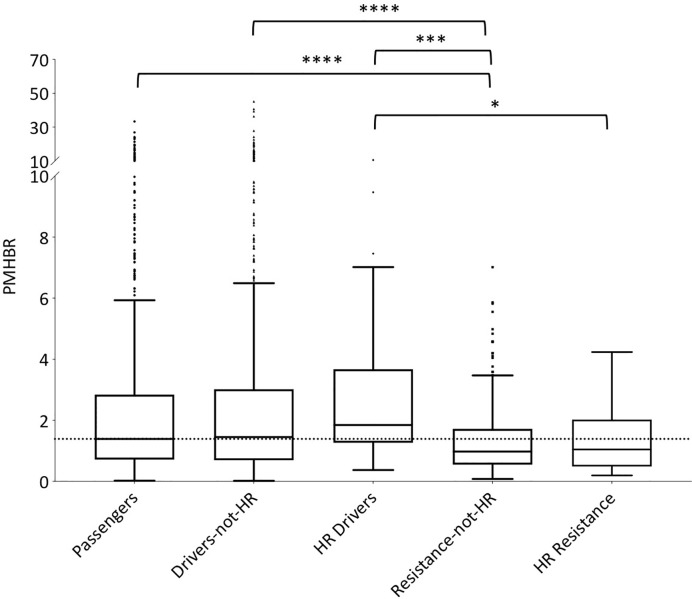
Figure 1.
Distribution of PMHBR scores for different sets of mutations. Lower PMHBR values correspond to a higher likelihood of being presented by HLA class I complexes across our set of 1000G healthy individuals. We consider passenger and driver mutations from TCGA and resistance mutations from COSMIC. Driver mutations are split according to their level of recurrence in TCGA patients (drivers-not-HR = less than 30 patients, HR-drivers = at least 30 patients). Similarly, resistance mutations are split according to their level of recurrence in patients as reported in COSMIC (resistance-not-HR = less than 20 patients, HR-resistance = at least 20 patients). Note that absolute numbers in the level of recurrence for driver versus resistance mutations are not easily compared (see Methods). The dotted horizontal line is a guide for the eye and corresponds to the value of the median of the distribution for passenger mutations. Note that, for the sake of readability, the part of the y-axis corresponding to values of PMHBR above 10 is compressed. Asterisks indicate significance of differences between PMHBR score distributions calculated using a Kruskal-Wallis test followed by Dunn’s post hoc test. p-values are adjusted for multiple testing (all vs. all). (*) stands for p-value < 0.05, (***) for p-value < 0.001 and (****) for p-value < 0.0001. The lower and higher edges of each Tukey box represent the 25 and 75% percentile value, respectively. The horizontal line inside each box represents the median value.

