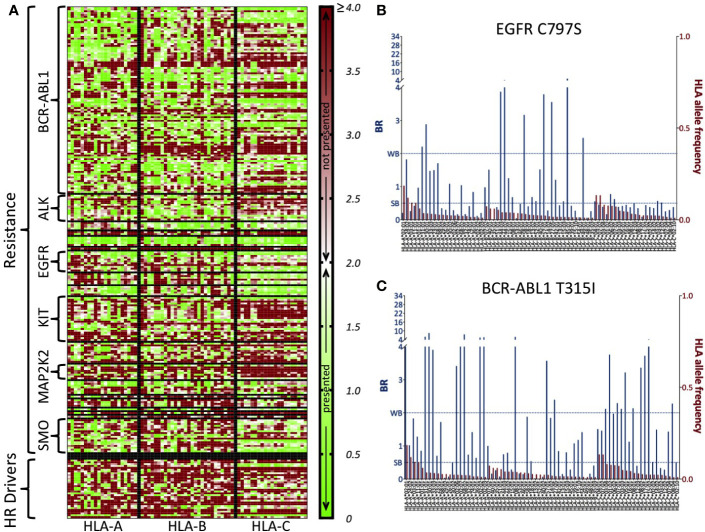
Figure 2.
BR score-based HLA-presentation profiles of all COSMIC resistance mutations and highly recurrent (HR) driver mutations. (A) Heatmap of BR scores for 226 resistance mutations and 32 HR driver mutations (rows) versus 70 common HLA allotypes (those with frequency >1% in 1000G, columns). Low BR values (green) indicate high predicted likelihood of HLA-presentation of at least one neopeptide associated to the mutation. High BR values (red) indicate that there is no neopeptide associated to the mutation that is predicted likely to be HLA-presented. The middle point in the scale (white) corresponds to BR = 2.0, which is the threshold for peptide presentation (<2.0 means presentation, >=2.0 means no presentation). Values of BR above 4 are all colored with the same shade of red as BR = 4.0. HLA allotypes are ordered according to decreasing frequency in 1000G and separately for the three HLA-A, -B, and -C genes (vertical lines). Resistance mutations are grouped according to the gene they occur in (horizontal lines). For the sake of readability, we write only some of the resistance gene names and HR driver mutations are grouped all together. (B) BR scores for resistance mutation C797S in EGFR and (C) T315I in BCR-ABL1. Blue bars (primary y-axis) represent the BR scores of the mutation with respect to the HLA allotypes reported on the x-axis. Red bars (secondary y-axis) represent the frequency of each HLA allotype in the 1000G dataset. We report BR scores for only the HLA-A, -B, and -C allotypes that have frequency >1% in 1000G. The two dotted lines mark elution rank value limits for strong likelihood of presentation (SB, i.e., BR score < 0.5) and weaker likelihood of presentation (WB, i.e., 0.5<= BR score < 2.0). Note that in panels (B, C), for the sake of readability, the part of the primary y-axis corresponding to values of BR above 4 is compressed.

