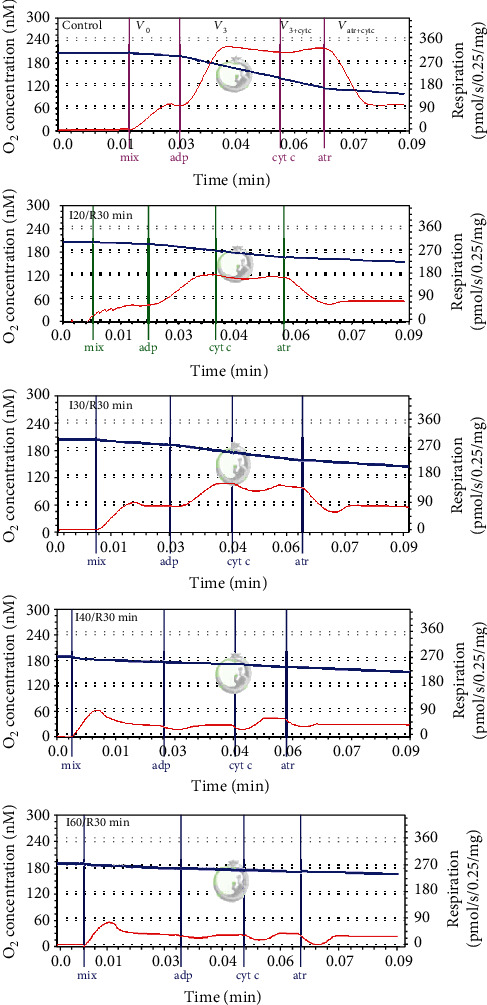
Figure 1.

Original curves of kidney mitochondrial respiration in the control and ischemia/reperfusion (I/R) groups. Mitochondrial respiration rate was measured as described in Methods using 5 mM glutamate plus 5 mM malate as substrates. The blue trace represents oxygen concentration (nmol/mL), and the red trace represents oxygen flux. I20/R30, I30/R30, I40/R30, and I60/R30 refer to different ischemia durations (respectively, 20, 30, 40, and 60 minutes) following by 30-minute reperfusion. V0: routine respiration rate in the presence of 0.5 mg/mL of mitochondria and substrates; V3: state 3 respiration rate in the presence of 1 mM ADP; V3+cyt c: state 3 respiration rate in the presence of 32 μM cytochrome c; VATR (+cyt c): respiration rate in the presence of 0.12 mM atractyloside and 32 μM cytochrome c.
