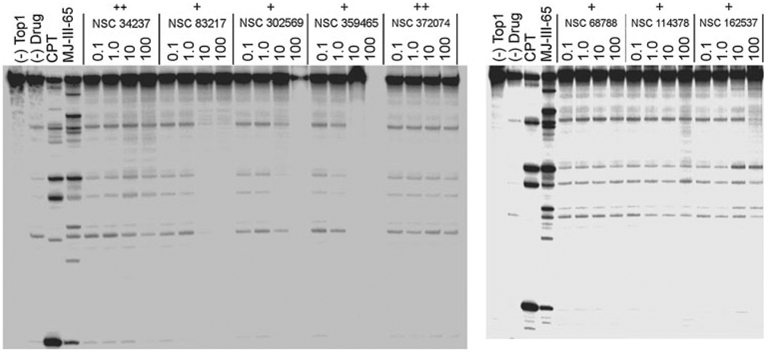
Fig. 5.

Top1-mediated DNA cleavage induced by tested compounds. The two gels indicate: DNA alone (lane 1, (−) Top1); Top1 + DNA (lane 2, (−) Drug); Top1 + DNA + 1 μM CPT (lane 3, CPT), Top1 + DNA + 1 μM MJ-III-65 (lane 4, MJ-III-65); Top1 + DNA + compounds tested at a concentration of 0.1, 1, 10 and 100 μM (other lanes). The scoring of the activity is defined as follows: +: 25–50 % CPT activity; ++: 50–75 % CPT activity
