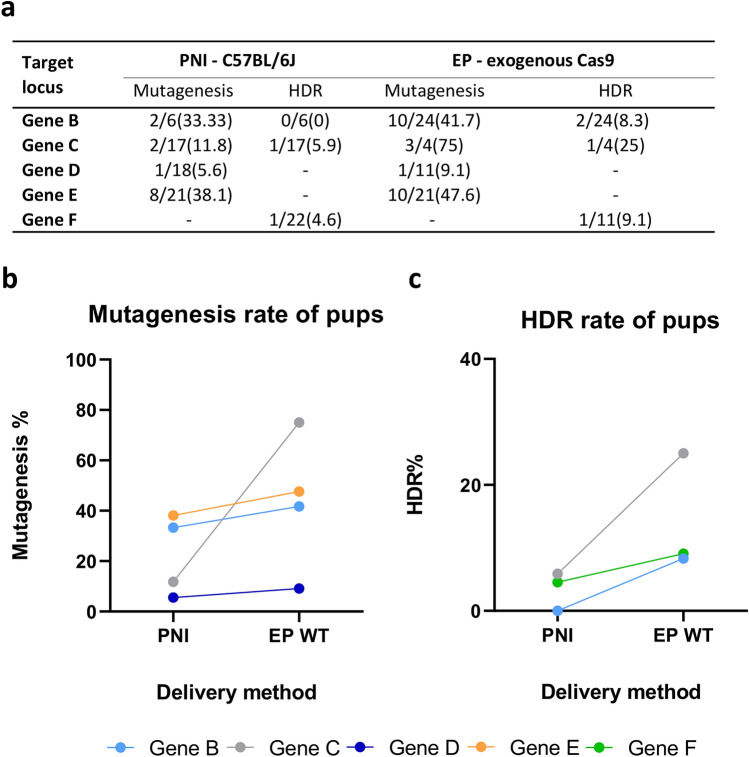
Figure 3.
Comparison of pronuclear microinjection versus electroporation (live pups). (a) Table summarizing editing efficiency at 5 gene loci in live pups after pronuclear microinjection (PNI) or electroporation (EP) of CRISPR reagents into wild-type C57BL/6J zygotes. (b) Total mutagenesis rate at 4 gene loci in live pups obtained from pronuclear microinjection (PNI) or electroporation (EP WT) of CRISPR reagents into wild-type C57BL/6J zygotes. (c) Rate of homology directed repair at 3 gene loci. Colours representing individual target loci are consistent across the figures (Supplementary Table 4).

