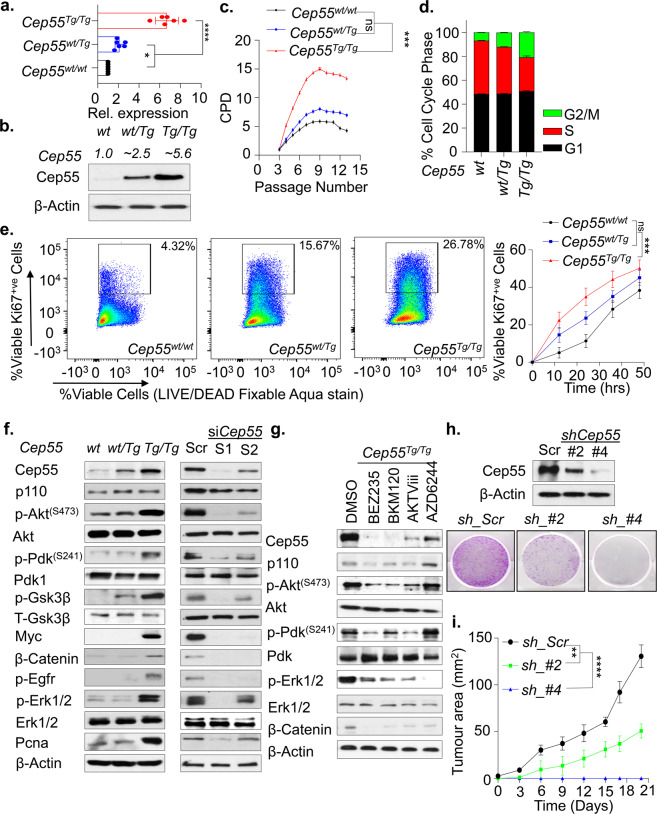
Fig. 3. Cep55 confers survival advantage through activation of signaling networks.
a Expression of Cep55 transcripts observed in the primary mouse embryonic fibroblasts (MEFs) of respective transgenic Cep55 genotypes. Three independent experiments with two technical replicates were performed. Error bars represent ± Standard Deviation (SD). One-way ANOVA test was performed to determine P-value < 0.05 (*) and < 0.0001 (****). b Immunoblot analysis of Cep55 expression in the whole cell lysates of the primary MEFs of each genotype. β-Actin was used as a loading control and relative fold difference in expression of Cep55, (indicated above calculated by densitometric analysis using ImageJ) observed among the MEFs of respective genotype (number of experimental representation, n = 2). c Proliferation measured as a function of passage number [indicated as CPD (cumulative population density)] using NIH-3T3 protocol in primary Cep55Tg/Tg MEFs in comparison to its littermates (n = 3 independent experiments with two technical replicates were performed. Error bars represent ± SD). One-way ANOVA test was performed to determine P-value < 0.0001 (****). d Cell-cycle profile of primary MEFs of indicated genotype measured post 24 h of culture by propidium iodide staining followed by FACS (n = 3 independent experiments with two technical replicates). Error bars represent ± SD). Two-way ANOVA test was performed to determine P-value is demonstrated in Supplementary Table 3. e FACS plot representing the percentage of Ki67 positive staining of viable cells from the respective genotype post 12 h of culture wherein 100,000 viable events were collected for each genotype (left). Quantification of the percentage of Ki67 positive viable cells of each genotype at the representative time points (right). Error bars represent the ± SD from three independent experiments. One-way ANOVA test was performed to determine P-value; <0.001 (***) and ns (not significant). f Immunoblot analysis of the whole cell lysates collected post 24 h culture from the immortalized MEF’s of indicated genotypes (left panel) and post 48 h from the respective siRNA treated Cep55Tg/Tg MEFs (right panel) indicating the impact of Cep55 overexpression on multiple cell signaling pathways. β-Actin was used as a loading control. g Immunoblot analysis of the whole cell lysates collected after 24 h of treatment of immortalized Cep55Tg/Tg MEFs with the respecting inhibitors such as BEZ235 (pan-PI3K/AKT inhibitor), BKM120 (pan-PI3K inhibitor), AKTVIII (AKT inhibitor), and AZD6244 (MEK1/2 inhibitor). β-Actin was used as a loading control. h Immunoblot analysis of the whole-cell lysates collected from the respective isogenic Cep55-depleted TCLs at 24 h validating the levels of Cep55 expression. β-Actin was used as a loading control (top panel). Representative images of colony formation at 14 days determined using crystal violet staining in control and Cep55-depleted TCLs (bottom panel). i Six-week-old female NOD/Scid cohorts of mice were injected subcutaneously with the control and Cep55-depleted clones. Growth rates (area, mm2) of the tumors were measured using a digital caliper. Differences in growth were determined using Student’s t test, P ≤ 0.0001 (****). Graph represents the mean tumor area ± SD, n = 5 mice/group.

