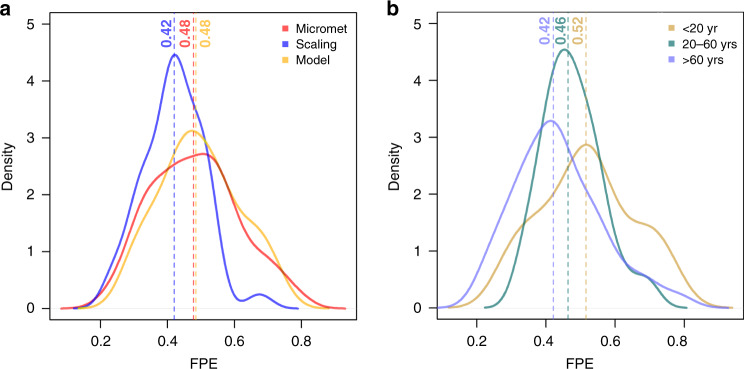
Fig. 2. Effects of GPP method and age on FPE variability.
a Forest production efficiency (FPE) density plots for three subsets of data where the GPP was estimated with three different methods (micrometeorological, red line, n = 98; scaling, blue line, n = 73; and models, green line, n = 53). The vertical lines are medians. b Density plots for different age classes (age < 20 years, light brown line, n = 47; 20–60 years, green line, n = 49; and age > 60 years, blue line, n = 77).

