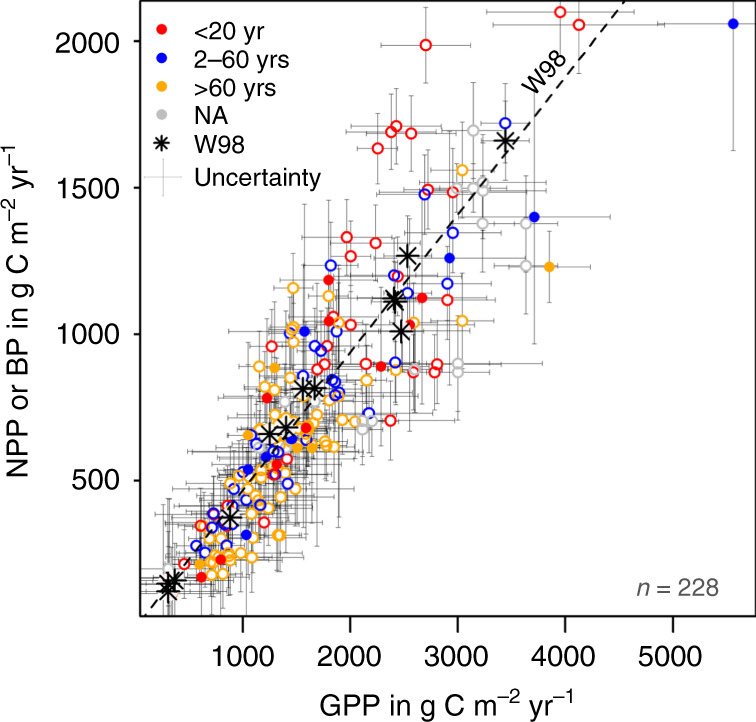
Fig. 3. Comparison of the present work dataset vs. Waring et al.6.

Scatter plot of net primary production (NPP, gC m−2 yr−1) or biomass production (BP, gC m−2 yr−1) versus gross primary production (GPP, gC m−2 yr−1) (n = 228). Open circles: BP, filled circles: NPP. Stars represent data points from Waring et al.6. The line marked with W98 represents a CUE (i.e. NPP/GPP) of 0.47. Age classes are marked by colours (see top left of the figure); NA stands for ‘age not available’. The uncertainty (gC m−2 yr−1) of the data points is indicated by bars (for data uncertainty see Methods).
