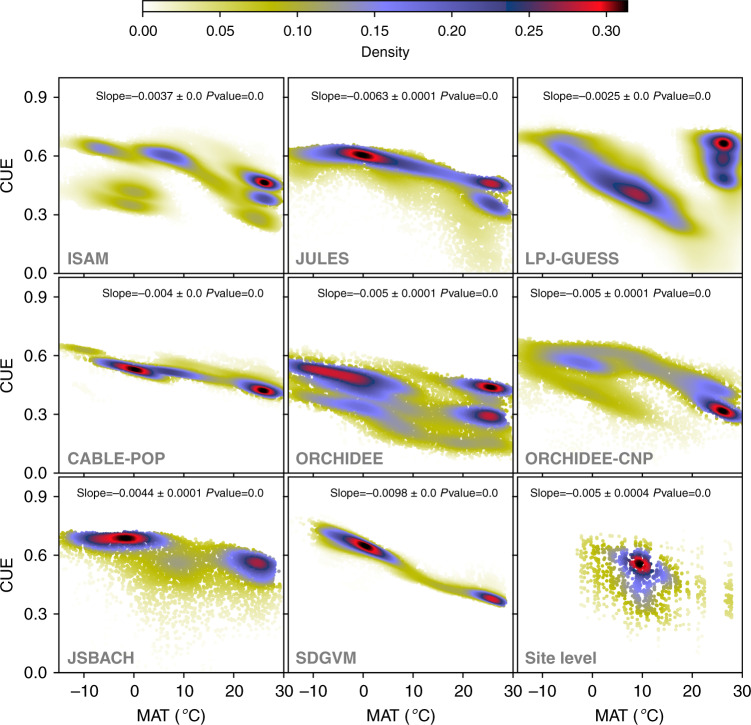
Fig. 5. Modelled TRENDY v.7 CUE and growth temperature patterns.
Density plots (i.e. frequency of forest carbon use efficiency (CUE) value divided by the total number of grid cells of simulated CUE derived from the following TRENDY v.7 process-based models: ISAM, JULES, LPJ-GUESS, CABLE-POP, ORCHIDEE, ORCHIDEE-CNP, JSBACH and SDGVM, averaged from 1995 to 2015 as function of MAT (°C). In the last (right bottom) density plot, data points extracted from coordinates and times of observed sites and used to plot the simulated CUE as function of MAT from the eight TRENDY v.7 models.

