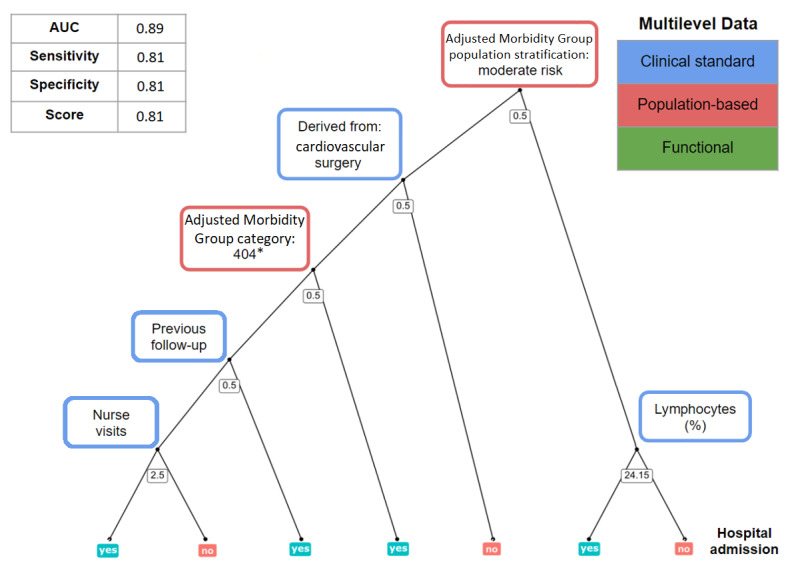
Figure 2.

Overview of the predictive modeling strategy taking, as an example, prediction of re-admission at home hospitalization discharge. Upper-left table: metrics used for model performance assessment; AUC: area under the receiver operating characteristic curve. Center figure: representation of 1 decision tree using a random subset of features; on the nodes, threshold values for each variable determine the path from the root to the leaves (0.5 for Boolean variables), moving toward the left when the decision rule is meet; on a random forest model, final predictions are averaged over multiple decision trees. Upper-right table: 3 categories of data that are included in the models. *GMA category 404; 40: patient with active neoplasms; 4: high complexity conditions (percentile between 0.85 and 0.95).
