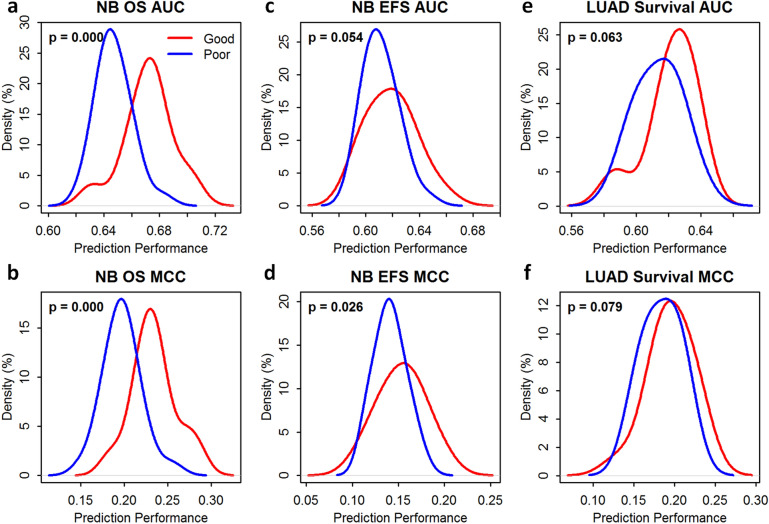
Figure 4.
RNA-seq pipelines selected based on benchmark metrics (i.e., accuracy, precision, and reliability) were informative for inferring the performance of gene-expression-based prediction of disease outcome—(a) prediction performance measured by the area under the receiver operating characteristic curve (AUROC, or AUC) for the overall survival (OS) endpoint of the SEQC-neuroblastoma (NB) dataset; (b) prediction performance measured by the Matthews correlation coefficient (MCC) for the OS endpoint of the SEQC-NB dataset; (c) prediction performance measured by the AUC for the event-free survival (EFS) endpoint of the SEQC-NB dataset; (d) prediction performance measured by the MCC for the EFS endpoint of the SEQC-NB dataset; (e) prediction performance measured by the AUC for the survival endpoint of the TCGA-lung-adenocarcinoma (LUAD) dataset; and (f) prediction performance measured by the MCC for the survival endpoint of the TCGA-LUAD dataset. The red line in each panel shows the probability density of the prediction performance of good-performing RNA-seq pipelines selected based on benchmark metrics; and the blue line demonstrates that of poor-performing pipelines selected based on the same. Statistical significance (i.e., p-values) was determined using the one-sided Wilcoxon rank-sum test. (a,b,d) show statistically significant difference (p < 0.05) between the two groups (i.e., the prediction performance of good-performing pipelines vs. that of poor-performing pipelines). The good-performing (Top 10%) and poor-performing pipelines (Bottom 10%) were determined based on the average rank of each RNA-seq pipeline over all benchmark metrics of both all and low-expressing genes.

