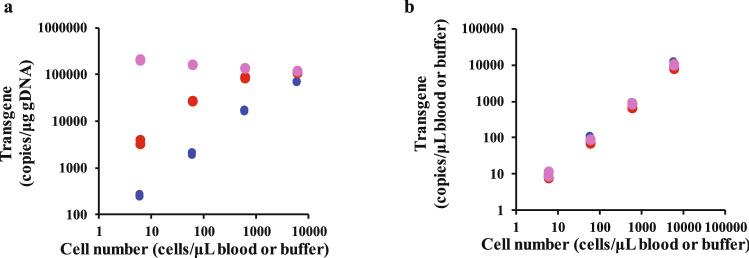
Figure 3.
Ex vivo dose-proportionality of transgene copy numbers. Each point shows the transgene level expressed in units of (a) copies/μg gDNA and (b) copies/μL blood or buffer against cell concentration in human blood or buffer. Blue, red, and pink points represent healthy human blood, lymphocyte-depleted human blood, and buffer, respectively. Target1-CAR T-cells were added to healthy human blood, lymphocyte-depleted human blood, and buffer at final concentrations of 3000 to 300,000 cells/0.5 mL blood or buffer (600 to 60,000 cells/μL blood or buffer). The samples were prepared in triplicate for each concentration.

