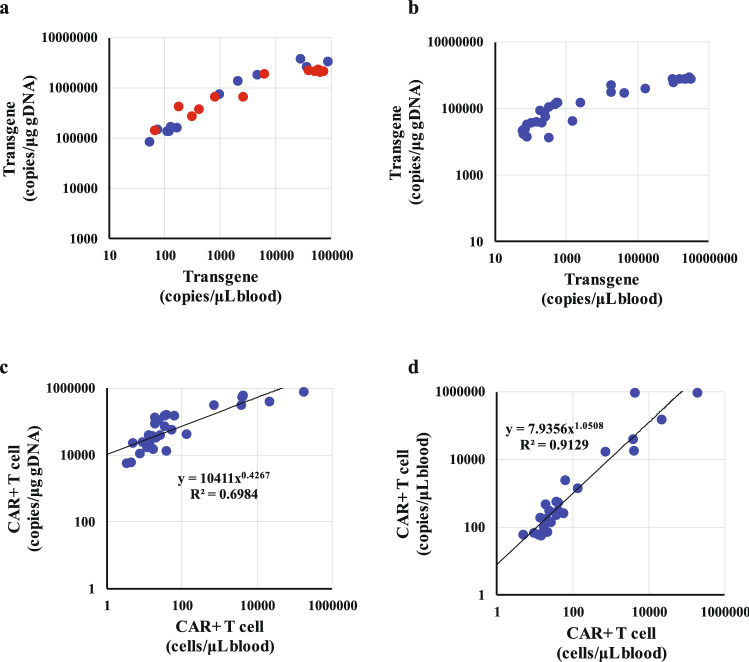
Figure 4.
In vivo expansion of target1- and target2-CAR T-cells after injection in immunodeficient mice (n = 3 to 5 per dosage). Each point shows transgene level or CAR T-cell number. (a) Comparison of target1-CAR T-cell level expressed in units of copies/μg gDNA and copies/μL blood. Blue and red points represent doses of 5 × 10⁶ and 10 × 106 CAR+ cells/animal, respectively. (b) Comparison of target2-CAR T-cell level expressed in units of copies/μg gDNA and copies/μL blood. (c) Comparison of target2-CAR T-cell level expressed in units of copies/μg gDNA and CAR+ cell number quantified by flow cytometry. (d) Comparison of target2-CAR T-cell level expressed in units of copies/μL blood and CAR+ cell number quantified by flow cytometry.

