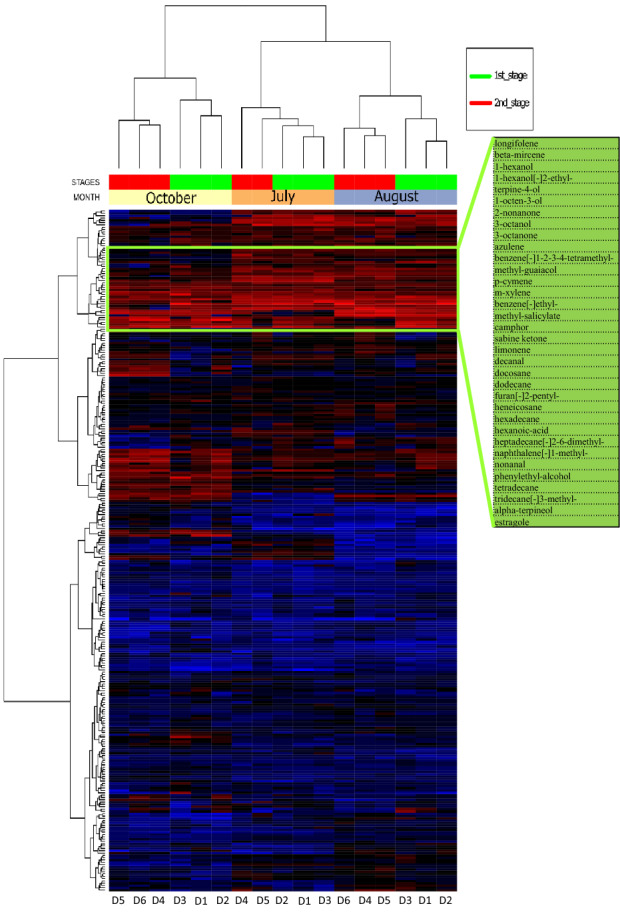
Figure 6.

Heatmap and hierarchical clustering based on the normalized quantities of the identified VOCs, for PTB herbs in the six days (d1, d2, d3, d4, d5, and d6) and three months (July, August and October) of sampling. The highest content is in red and the lowest in blue. The values have been UV scaled and clustered according the Ward algorithm. The list of the 34 compounds highlighted in the upper side represents the most abundant (core) VOCs found. In July, d6 is missing as the sample has not been collected.
