
Figure 2.
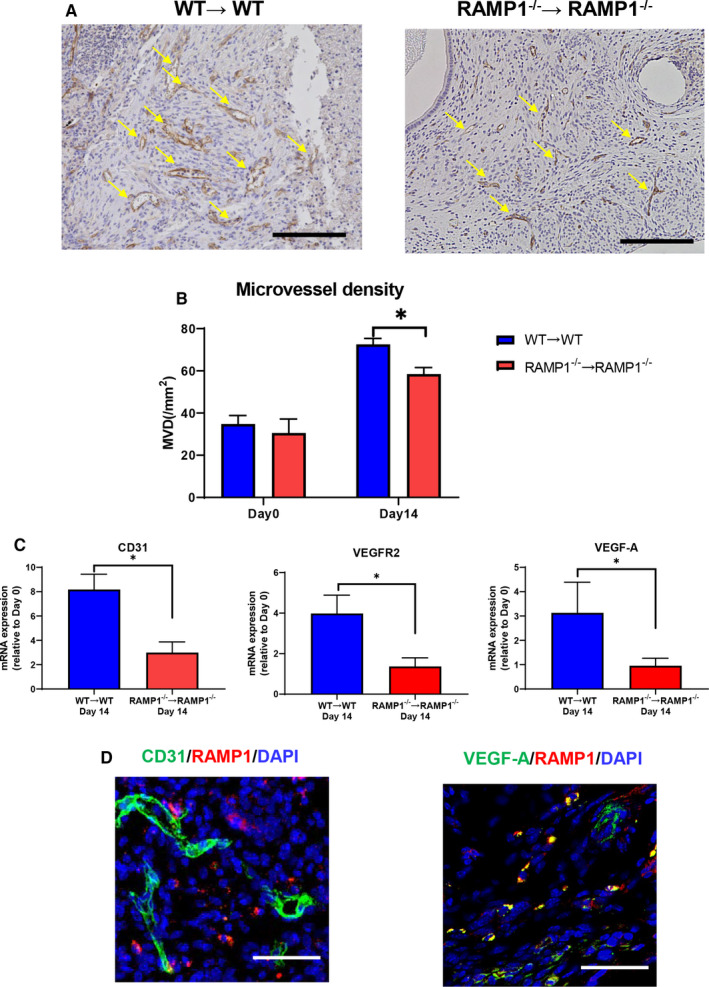
Angiogenesis in the endometrial tissue implants from WT → WT and RAMP1−/− → RAMP1−/− mice. A, Immunohistochemical staining of CD31 in endometrial implant sections from WT → WT and RAMP1−/− → RAMP1−/− mice on day 14. Scale bar, 200 μm. Arrows indicate CD31+ cells. B, MVD in the endometrial tissue implants from WT → WT and RAMP1−/− → RAMP1−/− mice on days 0 and 14. Data are expressed as the mean ± SD (n = 4‐5 mice per group). *P < .05. C, The level of mRNA encoding CD31, VEGFR2 and VEGF‐A in endometrial tissue implants from WT → WT and RAMP1−/− → RAMP1−/− mice on day 14. Data are expressed as the mean ± SD (n = 6 mice per group). *P < .05. D, Double immunofluorescence staining of CD31 (green)/RAMP1 (red) and VEGF‐A (green)/RAMP1 (red) in endometrial tissue implants from WT → WT mice on day 14. Scale bars, 50 μm