Figure 6.

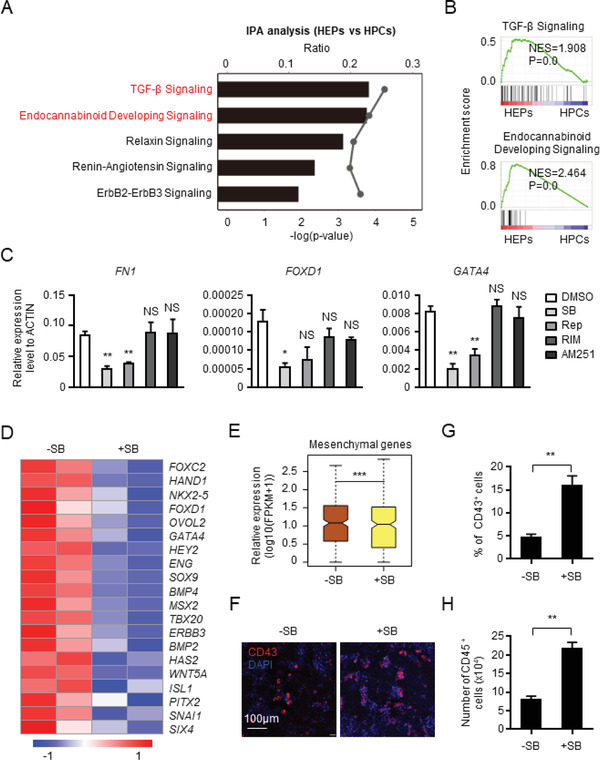
The suppressive role of TGF‐β signaling in downregulation of mesenchymal genes and EHT. A) IPA showing the potential signaling pathways controlling transition from HEPs to HPCs. B) Comparison of “TGF‐β signaling” and “Endocannabinoid developing signaling”‐associated gene expression between HEPs and HPCs. C) The relative mRNA expression level of representative mesenchymal genes with or without the treatment of SB431542 (SB) and Repsox (Rep), the chemical inhibitors of TGF‐β signaling, or Rimonabant (RIM) and AM251, inhibitors of endocannabinoid developing signaling. D) The heatmap showing the expression of mesenchymal genes in the CD31+ cells with or without SB treatment. E) The box plot showing the expression of mesenchymal genes in the CD31+ cells with or without SB treatment. F) The immunofluorescence of CD43+ HPCs with or without SB treatment. G,H) The percentage of CD43+ HPCs (G) and the number of CD45+ HPCs (H) with or without SB treatment. NS, not significant, *P < 0.05, **P < 0.01, and ***P < 0.001.
