Figure 2.

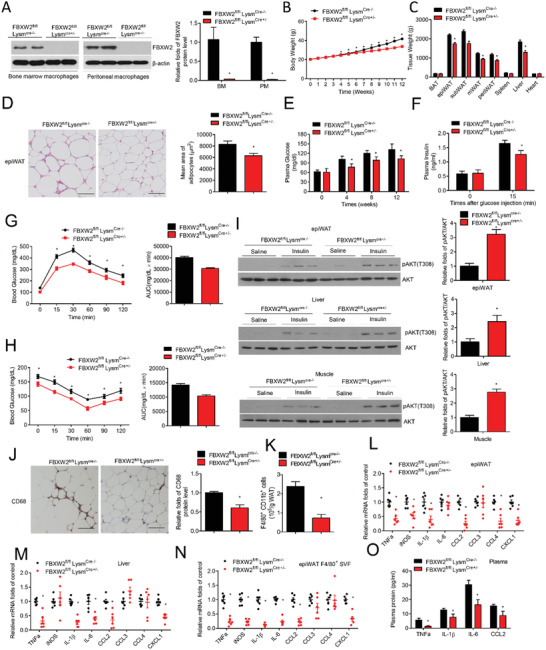
Myeloid FBXW2 deletion alleviates insulin resistance and inflammation in obesity. Age‐matched FBXW2fl/flLysmCre‐/− and FBXW2fl/flLysmCre+/− mice were fed a HFD for 12 weeks (n = 12). A) FBXW2 expression in BMDMs and PMs in FBXW2fl/flLysmCre‐/− and FBXW2fl/flLysmCre+/− mice were determined by western blot assay. B) Body weight was tested in HFD‐fed FBXW2fl/flLysmCre‐/− and FBXW2fl/flLysmCre+/− mice during the feeding time (n = 12). C) The different tissue weights were assessed in FBXW2fl/flLysmCre‐/− and FBXW2fl/flLysmCre+/− mice on HFD after 12 weeks (n = 12). D) H&E staining analysis and quantification of the adipocyte size of epiWAT from FBXW2fl/flLysmCre‐/− and FBXW2fl/flLysmCre+/− mice. Scale bars, 50 µm. E) The blood glucose in fasted FBXW2fl/flLysmCre‐/− and FBXW2fl/flLysmCre+/− mice (n = 9). F) The insulin levels in basal and stimulated condition in FBXW2fl/flLysmCre‐/− and FBXW2fl/flLysmCre+/− mice (n = 7). G) Glucose tolerance test (GTT) and H) insulin tolerance test (ITT) on fasted FBXW2fl/flLysmCre‐/− and FBXW2fl/flLysmCre+/− mice (n = 10). I) After insulin administration, tissues extracts in epiWAT, liver and skeletal muscle were subject to western bolt for the levels of AKT phosphorylation and total AKT. J) Representative immunohistochemical staining for CD68+ macrophages in epiWAT from FBXW2fl/flLysmCre‐/− and FBXW2fl/flLysmCre+/− mice (n = 5). Scale bars, 50 µm. K) Quantification of CD11b+ F4/80+ cells in epiWAT from FBXW2fl/flLysmCre‐/− and FBXW2fl/fl LysmCre+/− mice by flow cytometry (n = 6). The mRNA levels of proinflammatory factors in L) epiWAT, M) liver, and N) F4/80+ SVFs in FBXW2fl/flLysmCre‐/− and FBXW2fl/flLysmCre+/− mice (n = 6). O) Plasma contents of CCL2, TNF‐α, IL‐6, and IL‐1β in FBXW2fl/flLysmCre‐/− and FBXW2fl/flLysmCre+/− mice (n = 8). The data are shown as the mean ± SEM. *p < 0.05 by Student's t test.
