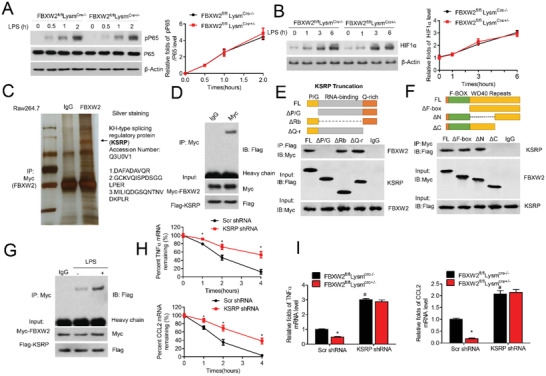
Figure 4.

FBXW2 binds directly to KSRP. Western blot analysis of A) phosphorylated P65 (p‐P65) and total P65, and B) HIF‐1α in the lysates of BMDMs from FBXW2fl/flLysmCre‐/− and FBXW2fl/flLysmCre+/− mice with LPS stimulation for the indicated durations. C) FBXW2‐associated protein complexes from the peritoneal macrophage extracts of HFD‐fed mice were subjected to mass spectrometry analysis. The black arrow indicates the peptides identified. D) Raw264.7 cells were transfected with Myc‐tagged FBXW2 and Flag‐tagged KSRP. Co‐immunoprecipitation (Co‐IP) assays analysis of the interaction between FBXW2 and KSRP. E) Diagram of Flag‐tagged human KSRP with its domains: P/G rich domain (P/G), RNA binding domain (RBD), and Q rich domain (Q‐r). HEK293T cells were transfected with Myc‐tagged full‐length FBXW2 and Flag‐tagged KSRP mutants. Co‐IP assays demonstrated the specific binding of FBXW2 to the P/G rich domain of KSRP. F) Diagram of Myc‐tagged human FBXW2 with its domains: F‐box domain (F‐box), N‐terminal WD40 repeat domain (N), and C‐terminal WD40 repeat domain (C). 293T cells were transfected with Flag‐tagged full‐length KSRP and Myc‐tagged FBXW2 mutants. Co‐IP assays demonstrated the specific binding of KSRP to the C‐terminal WD40 repeat domain of FBXW2. G) Co‐immunoprecipitation assays analysis of the interaction between FBXW2 and KSRP after LPS (1 µg mL−1) treatment in BMDMs. H) Scr shRNA or KSRP shRNA lentivirus‐infected macrophages were stimulated with LPS (1 µg mL−1) for 12 h, followed by 5 µg mL−1 of ActD to block transcription. The transcriptional levels of proinflammatory factors (CCL2 and TNF‐α) were tested by Real‐time qPCR assay (n = 5). I) PMs isolated from FBXW2fl/flLysmCre‐/− and FBXW2fl/fl LysmCre+/‐ mice were transduced with Scr shRNA or KSRP shRNA lentivirus, then treated with LPS (1 µg mL−1) for 12 h. The mRNA levels of proinflammatory factors (CCL2 and TNF‐α) were tested by Real‐time qPCR assay (n = 5). The data are shown as the mean ± SEM. *p < 0.05 and # p < 0.05 by ANOVA with the post‐hoc test.
