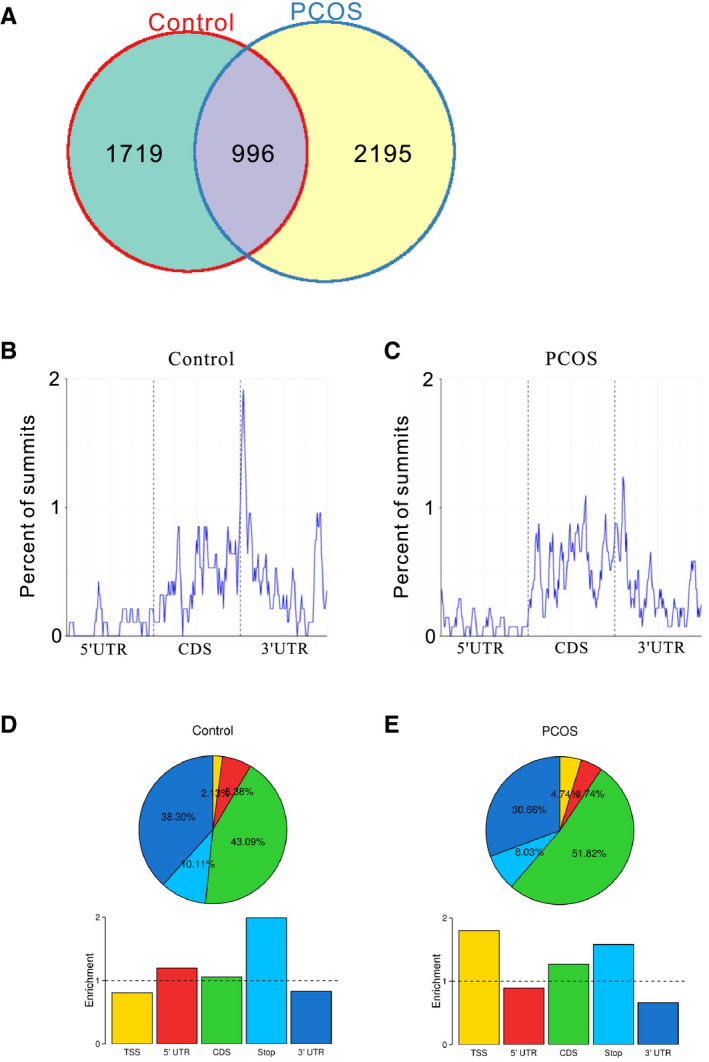
Figure 2.

Distribution of m6A peaks in the luteinized GCs of the controls and PCOS patients. A, Comparison of the m6A peaks between the controls and PCOS patients. (B and C) Metagene profiles of enrichment of m6A peaks across mRNA transcriptome of the controls (B) and PCOS patients (C). (D and E) Distribution and enrichment of the m6A peaks within different gene regions in the GCs of the controls (D) and PCOS patients (E). TSS, transcription start sites; 5’‐UTR, 5’‐untranslated region; CDS, coding sequence; Stop, translation termination sites; 3’‐UTR, 3’‐untranslated region
