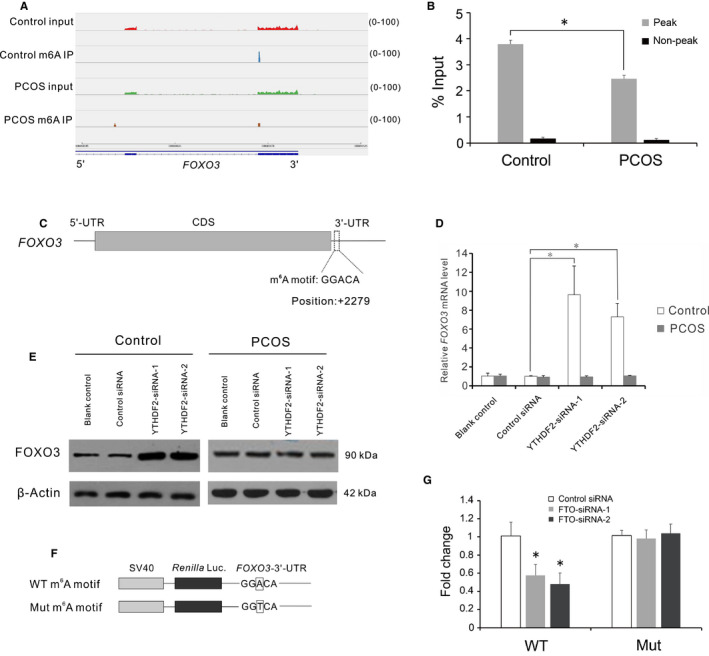
Figure 4.

Differentially methylated FOXO3 transcript was regulated via the YTHDF2‐mediated decay pathway in the luteinized GCs of the controls. A, m6A peaks distribution across 3’‐UTR of the FOXO3 transcript. The Y‐axis shows read number. Blue boxes indicate exons, and blue line indicates introns. B, qRT‐PCR analysis of m6A peak region and non‐peak region in the 3’‐UTR of the FOXO3 transcript. Bars represent means ± SD, n = 5. *P < 0.05 for the differences between the indicated groups. C, Schematic representation of the position of m6A motif in the 3’‐UTR of the FOXO3 transcript. D, The mRNA level of FOXO3 in the YTHDF2‐knockdown cells. Bars represent means ± SD, n = 5. *P < 0.05 for the differences between the indicated groups. E, Western blot analysis of FOXO3 total protein level in the YTHDF2‐knockdown cells. F, Wild‐type or m6A motif mutant (A‐to‐T mutation) FOXO3‐3’‐UTR fused with Renilla luciferase reporter. G, Relative luciferase activity of the FOXO3‐3’‐UTR with wild‐type or mutant m6A motif after cotransfection with negative control siRNA or FTO‐siRNA Renilla luciferase activity was normalized to firefly luciferase activity. Bars represent means ± SD, n = 3. *P < 0.05 vs the control siRNA group
