Figure 5.

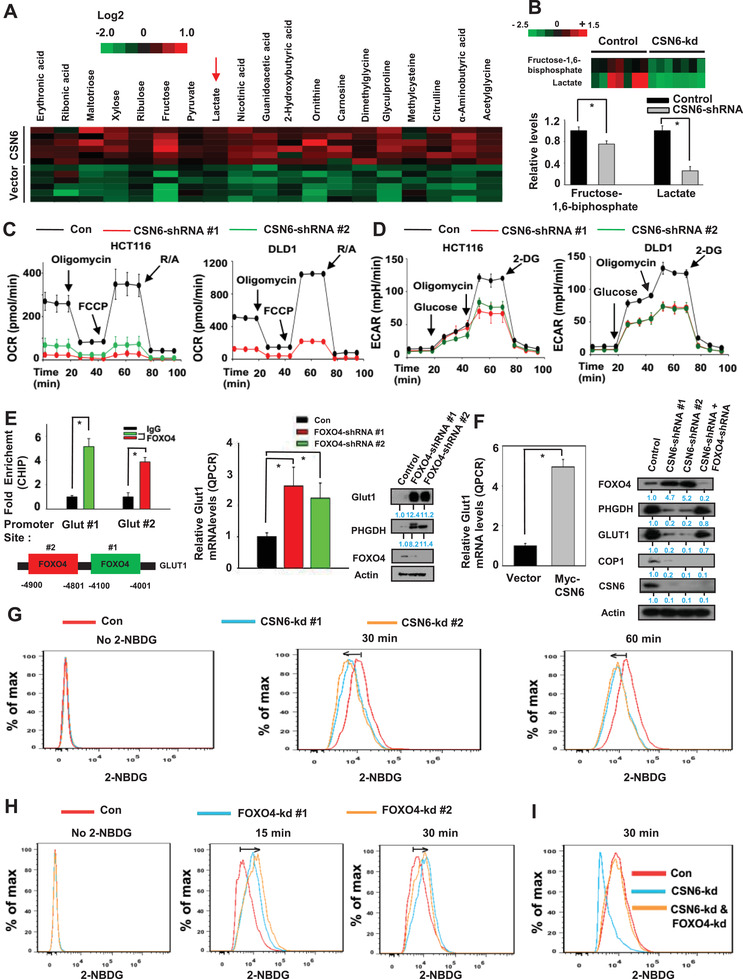
CSN6–FOXO4 axis regulates glucose uptake. A) Changes of metabolites were determined by mass spectrometry in HCT116 vector and CSN6 overexpressing cells. B) Knockdown of CSN6 reduces fructose‐1,6‐biphosphate and lactate production. Metabolic analysis determined by mass spectrometry in HCT116 cells infected with control shRNA or CSN6 shRNA. Bars represent average ± s.d., n = 7, student's t‐test, *P < 0.05. C,D) Oxygen consumption rates (OCRs) and extracellular acidification rates (ECARs) were measured in CSN6 knockdown HCT116 cells. Values are average ± s.d., n = 3. E) ChIP‐PCR analysis of Glut1 promoter in HCT116 cells using anti‐FOXO4 antibody and PCR primers. Enrichment of FOXO4 binding on the Glut1 gene promoter was presented as a bar graph (left, top). IgG was used as a control. Two putative FOXO4‐binding sites in Glut1 promoter are indicated (left panel, bottom). RT‐qPCR analysis of Glut1 in FOXO4 shRNA infected HCT116 cells (middle panel). Lysates of HCT116 cells infected with FOXO4 shRNA were immunoblotted with indicated antibodies (right panel). Bars represent average ± s.d., n = 3, student's t‐test (left panel) and one‐way ANOVA (right panel), *P < 0.05. F) Real‐time qPCR analysis of Glut1 in Myc‐CSN6 expressing HCT116 cells (left panel). Lysates of HCT116 cells infected with indicated shRNA were immunoblotted with indicated antibodies (right panel). Bars represent average ± s.d., n = 3, student's t‐test, *P < 0.05. G,H) HCT116 control and HCT116 CSN6 or FOXO4 knockdown cells were incubated with 2‐NBDG for the indicated period of time. 2‐NBDG uptake was measured by flow cytometry. I) Indicated knockdown cells were incubated with 2‐NBDG for 30 min. 2‐NBDG uptake was determined by flow cytometry.
