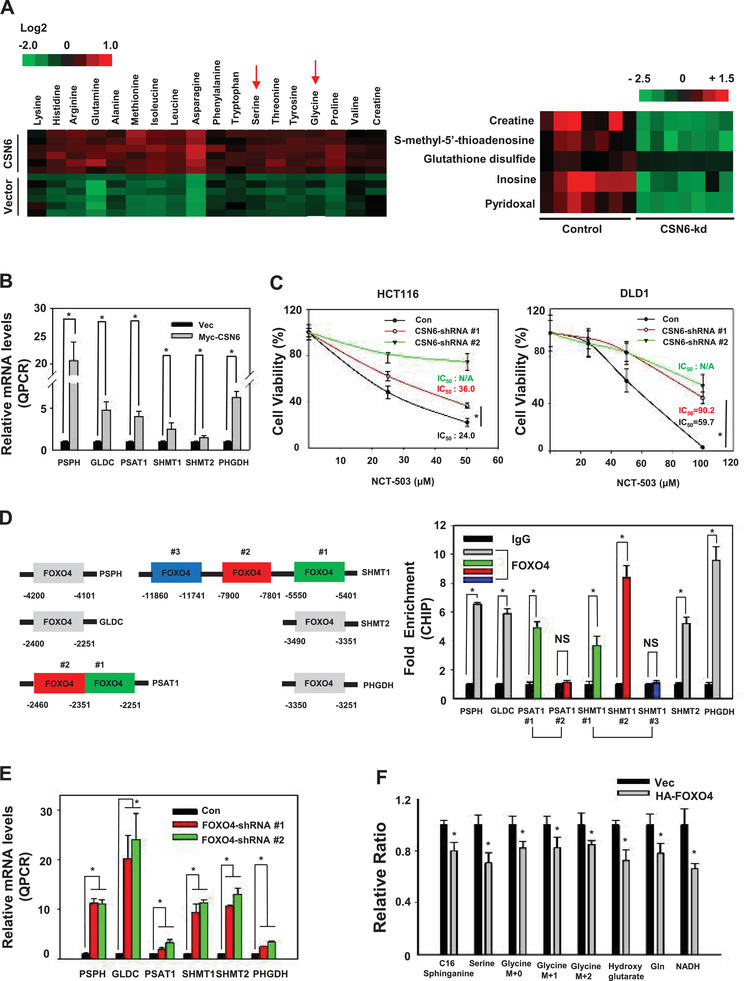
Figure 6.

CSN6‐FOXO4 axis regulates the expression of serine–glycine one carbon genes. A) Changes of serine and glycine metabolites were determined by mass spectrometry in HCT116 vector and CSN6 overexpressing cells (left panel). Changes of SGOC pathway‐related metabolites, including glutathione disulfides and pyridoxal, determined by mass spectrometry in HCT116 cells infected with control shRNA or CSN6 shRNA (right panel). B) Real‐time quantitative PCR analysis of serine pathway genes in Myc‐CSN6‐expressing HCT116 cells. Bars represent average ± s.d., n = 3, two‐tailed Student's t‐test, *P < 0.05. C) Indicated cell viability was measured by CCK8 at the indicated concentrations of NCT‐503. Values represent average ± s.d., n = 8, two‐tailed t‐test, *P < 0.05. D) ChIP‐PCR analysis of HCT116 cells using anti‐FOXO4 antibody and PCR primers. Promoter of the SGOC pathway genes contains putative FOXO4‐binding sites (left panel). Enrichment of FOXO4 binding on the serine pathway gene promoter was presented as a bar graph (right panel). IgG was used as a control. Bars represent average ± s.d., n = 3, two‐tailed Student's t‐test, *P < 0.05. E) Real‐time quantitative PCR analysis of serine pathway genes in FOXO4 knockdown HCT116 cells. Bars represent average ± s.d., n = 3, two‐tailed Student's t‐test, *P < 0.05. F) Incorporation of carbon‐13 (13C) from [U‐13C] glucose (11 × 10−3 m) into the indicated metabolites at 24 h in HCT116 cells. The data are presented as the means ± s.d. Bars represent average ± s.d., n = 3, two‐tailed Student's t‐test, *P < 0.05.
